AR Assisted Museum Tours Financial Model
5-Year Financial Projections
100% Editable
Investor-Approved Valuation Models
MAC/PC Compatible, Fully Unlocked
No Accounting Knowledge Needed
AR Assisted Museum Tours Financial Model
Bundle Includes:
-
Financial Model
-
Business Plan
-
Pitch Deck
-
Financial Dashboard
ALL IN ONE MEGA PACK - CONSIST OF:
AR Assisted Museum Tours Financial Model/Business Plan Excel Template
Pitch Deck Template For PowerPoint, Keynote & Google Slides
Business Plan Guide and Business Plan Template in MS Word Format
Financial Dashboard in Excel To Track Your Business Performance
AR ASSISTED MUSEUM TOURS FINANCIAL MODEL FOR STARTUP INFO
Highlights
This comprehensive five-year AR assisted museum tours financial model offers an in-depth revenue projection and cost analysis tailored for startups and entrepreneurs aiming to impress investors and secure funding. Incorporating key financial metrics, operational cost breakdowns, and financial forecasting for AR museum experiences, it provides a solid investment model and profitability plan. The built-in budget planning, expense forecasting, and monetization models for augmented reality tours enable accurate financial scenario planning and cost-benefit analysis, ensuring the financial viability and economic impact of AR museum tours are clearly demonstrated. Perfectly designed to support business planning with augmented reality museum tour pricing strategy and funding forecasts, this flexible 3-way financial model empowers you to evaluate your startup idea and unlock its full potential for growth and return on investment.
This AR museum tour financial model template addresses key pain points by offering a comprehensive cost benefit analysis of augmented reality museum tour operational costs, enabling users to conduct budget planning for AR museum tours with precision. It integrates financial forecasting for AR museum experiences alongside an investment model for AR enhanced tours, allowing for dynamic scenario planning and clear visualization of revenue streams and profitability metrics. Users can easily manipulate input assumptions to assess the financial viability of AR museum tours, explore monetization models for augmented reality tours, and develop a museum augmented reality pricing strategy that maximizes return on investment. This ready-made Excel tool streamlines expense forecasting and financial performance tracking, empowering startups and established museums alike to present a convincing AR museum tour business plan and secure augmented reality museum tour funding.
Description
The AR assisted museum tours financial model offers comprehensive financial forecasting for AR museum experiences, integrating detailed cost benefit analysis, expense forecasting, and revenue projection to support robust business planning. This model facilitates budget planning for AR museum tours by estimating initial capital investment, operational costs, and working capital requirements, enabling a precise projection of monthly sales and expenses over a 5-year period. Incorporating financial metrics and KPIs relevant to augmented reality museum tours, it supports financial viability assessments and profitability modeling, providing insights essential for devising an effective museum augmented reality pricing strategy and monetization models for augmented reality tours. Designed for both startups and established ventures, the template automates complex financial calculations, including profit and loss statements, cash flow forecasts, valuation charts, and investment models for AR enhanced tours, making it an indispensable tool for negotiations with investors and strategic decision-making based on financial scenario planning and return on investment analysis.
AR ASSISTED MUSEUM TOURS FINANCIAL MODEL FINANCIAL MODEL REPORTS
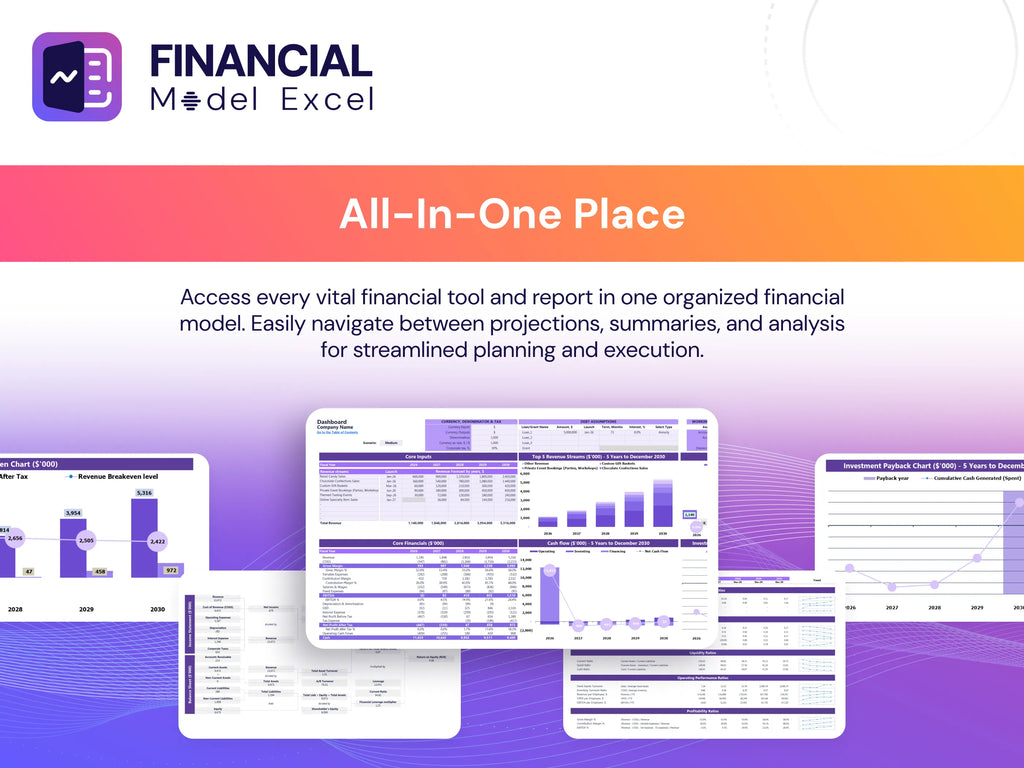
All in One Place
Developing a robust 5-year financial projection for your AR museum tour startup has never been easier. Our comprehensive AR museum tour business plan template includes detailed frameworks for augmented reality museum tour cost analysis, revenue projection, and expense forecasting. Leverage financial metrics for AR guided tours, explore monetization models for augmented reality tours, and conduct cost-benefit analysis to ensure strong financial viability. Whether planning budget, investment models, or pricing strategies, this flexible tool empowers you to confidently forecast profitability and drive sustainable growth in the evolving AR museum experience market.
Dashboard
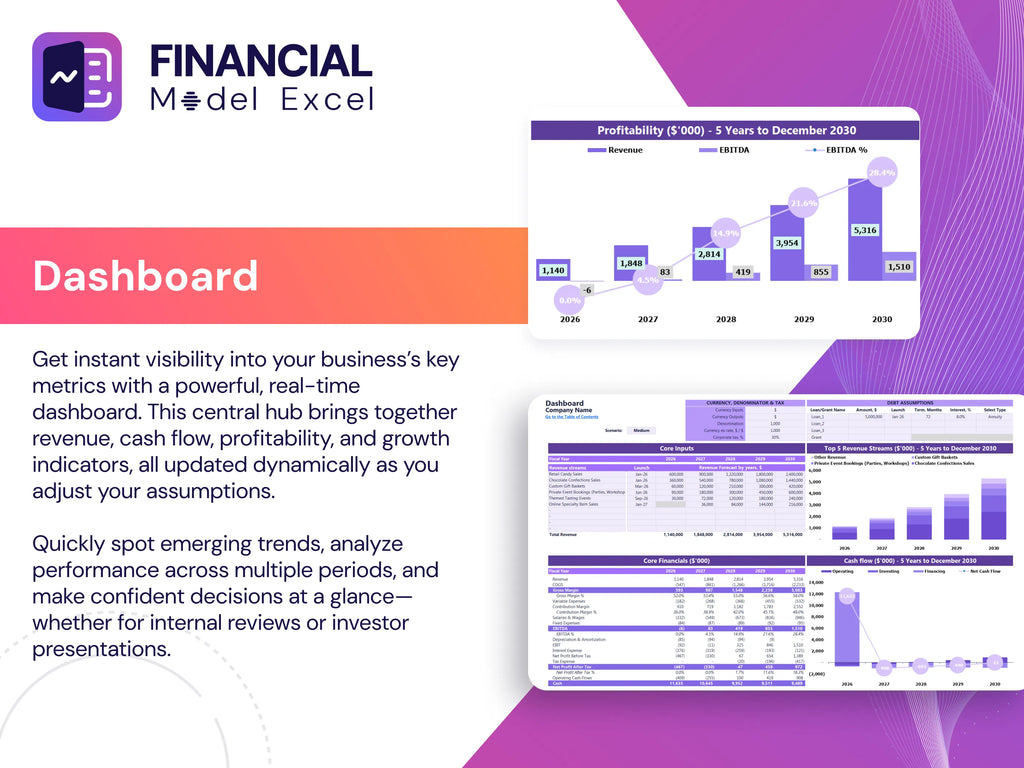
Our comprehensive AR museum tour financial model features an interactive dashboard showcasing key financial metrics across timeline phases. Visualized through intuitive graphs and charts, it provides detailed breakdowns of revenue projections, profit and loss highlights, cash flow forecasts, and operational cost analyses. This streamlined tool supports budget planning and expense forecasting while enhancing financial scenario planning for AR-enhanced tours. Designed for accuracy and clarity, it simplifies your cost-benefit analysis and strengthens your museum augmented reality pricing strategy, empowering confident decisions to maximize the financial viability and profitability of your AR museum tour investments.
Business Financial Statements
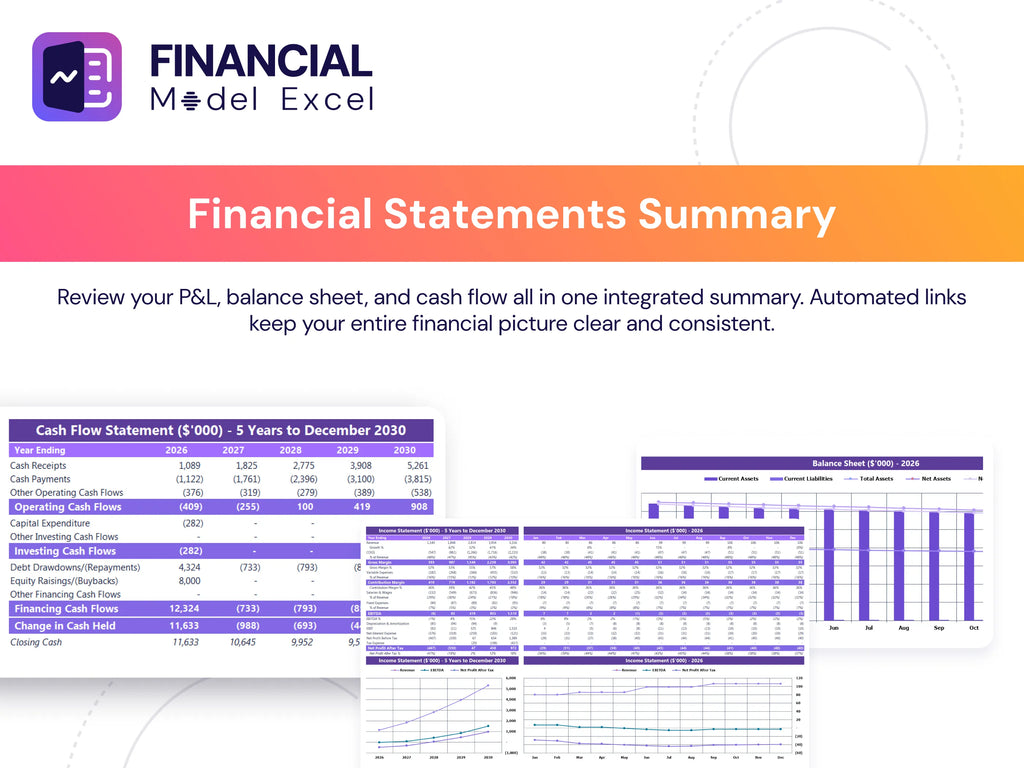
The startup financial statement comprises three key components essential for comprehensive financial forecasting of AR museum experiences. The Income Statement details revenue streams, expenses, depreciation, taxes, and interest income, crucial for assessing financial viability. The pro forma Balance Sheet highlights assets, liabilities, and shareholders’ equity, ensuring accurate budget planning for AR museum tours. Lastly, the Cash Flow Statement tracks cash inflows and outflows, demonstrating operational profitability and supporting investment models for AR-enhanced tours. Together, these provide a robust foundation for revenue projections, cost analysis, and profitability modeling in augmented reality museum tour ventures.
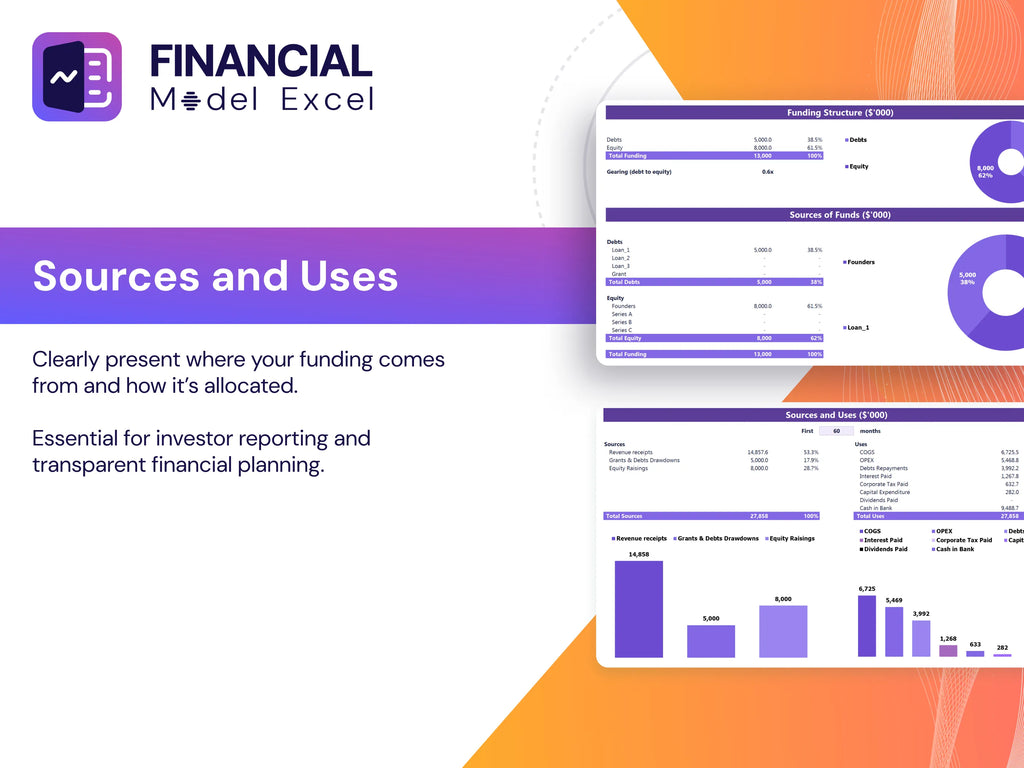
Sources And Uses Statement
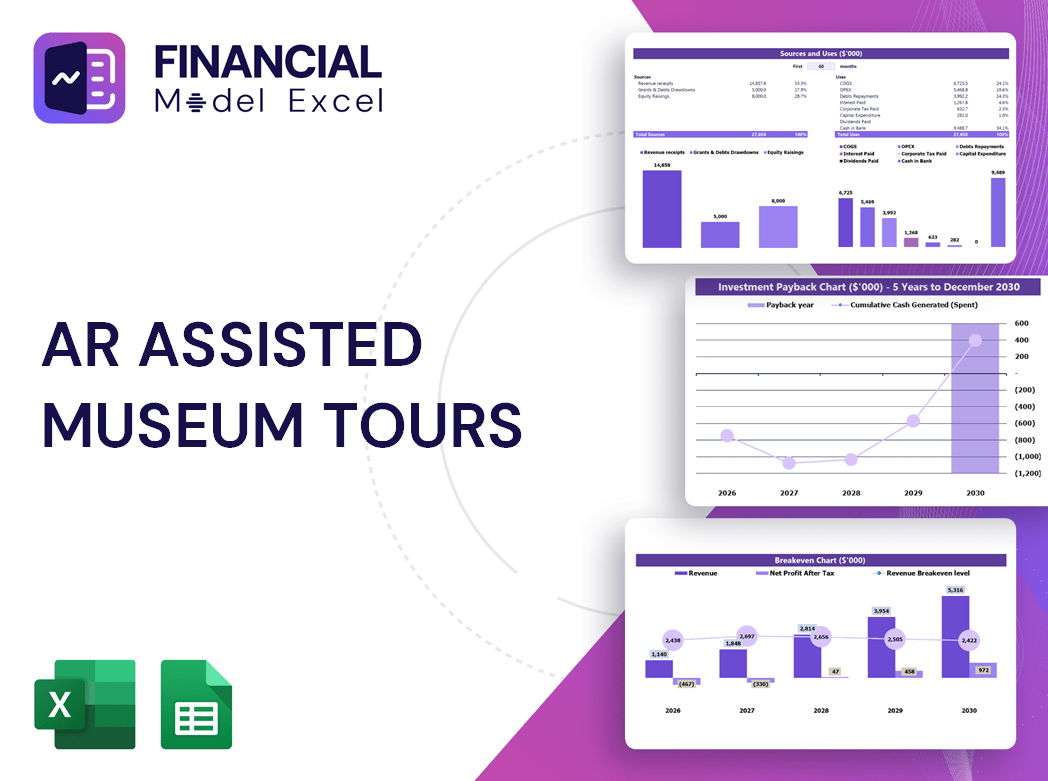
A comprehensive ar museum tour business plan with detailed budget planning and expense forecasting provides critical insights into sources of revenue and operational costs. Integrating financial forecasting for AR museum experiences enables a precise cost-benefit analysis and aids in developing a robust monetization model for augmented reality tours. This approach ensures accurate revenue projection and financial viability assessment, supporting informed decision-making and maximizing ROI. Employing an investment model for AR-enhanced tours enhances understanding of the museum augmented reality pricing strategy and overall economic impact, driving sustainable profitability and successful financial performance.
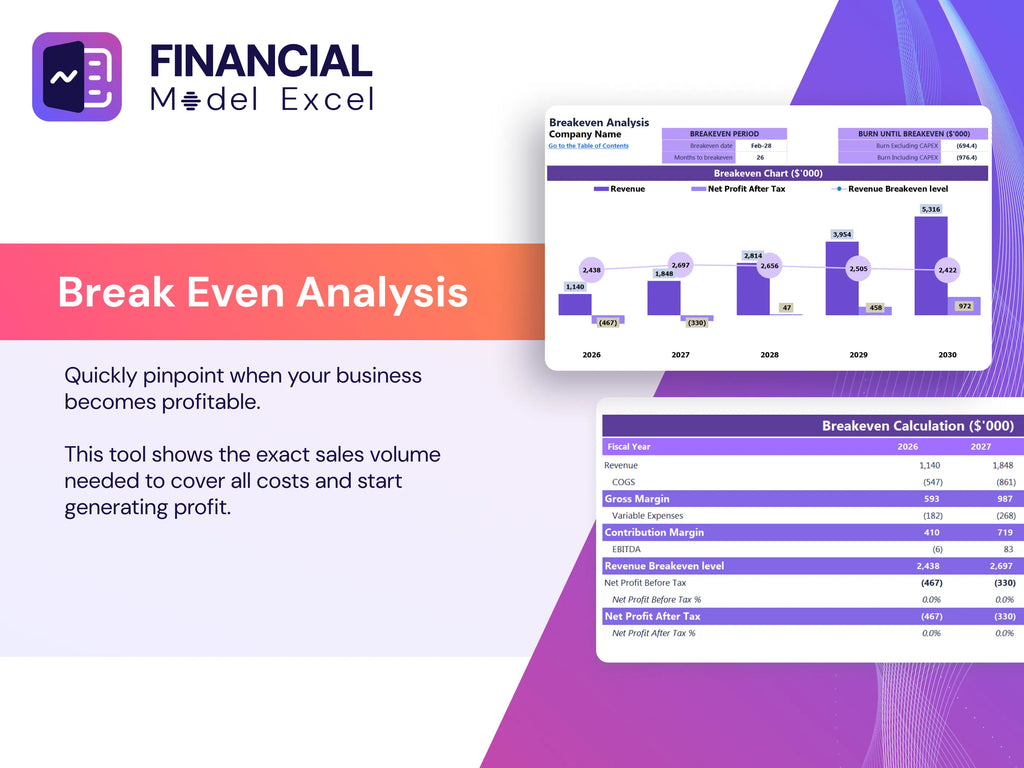
Break Even Point In Sales Dollars
The break-even graph highlights the critical point where total sales contribution matches fixed costs, resulting in zero profit or loss. This analysis, rooted in marginal costing, reveals varying cost behaviors across output levels. For AR museum tours, integrating this into financial forecasting and budget planning ensures precise assessment of profitability and operational costs. Understanding break-even sales volume aids in refining pricing strategies, projecting revenue streams, and evaluating the financial viability of augmented reality museum experiences within your investment model.
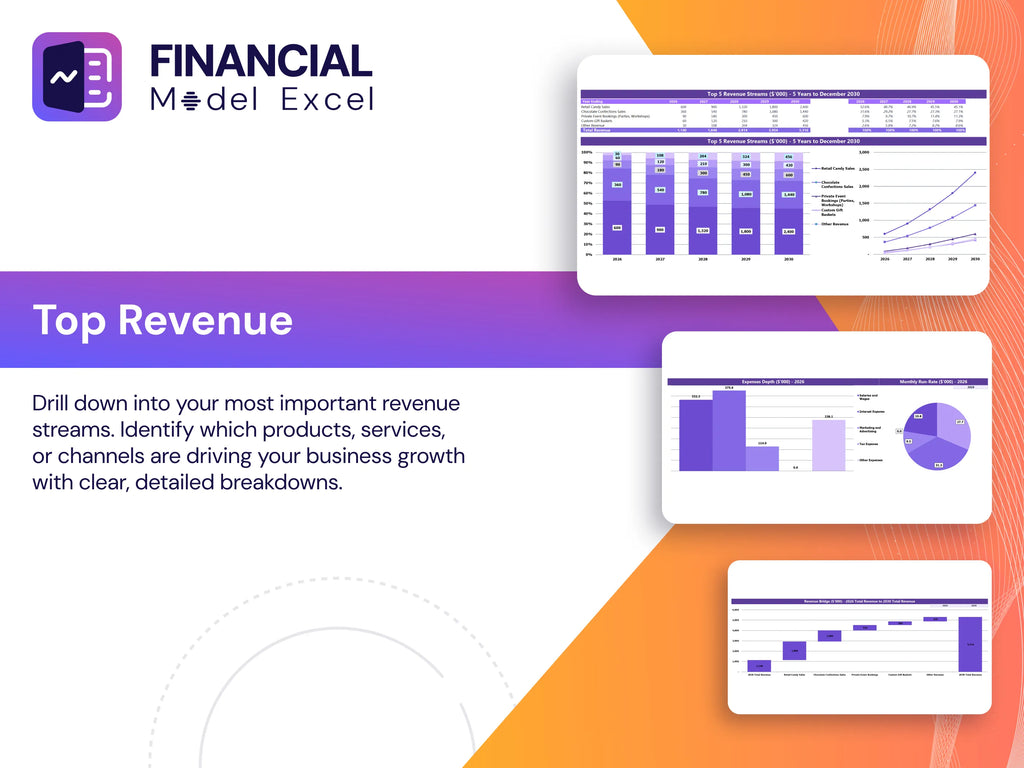
Top Revenue
The Top Revenue tab in this AR assisted museum tours revenue projection offers a detailed financial overview of each offering. Utilizing this 5-year financial forecasting template, you gain an annual breakdown of revenue streams, highlighting revenue depth and the revenue bridge. This powerful tool supports budget planning for AR museum tours, enabling precise ar museum tour expense forecasting and enhancing your ar museum tours financial performance. Perfect for refining your ar museum tour business plan and optimizing the financial viability of AR museum experiences.
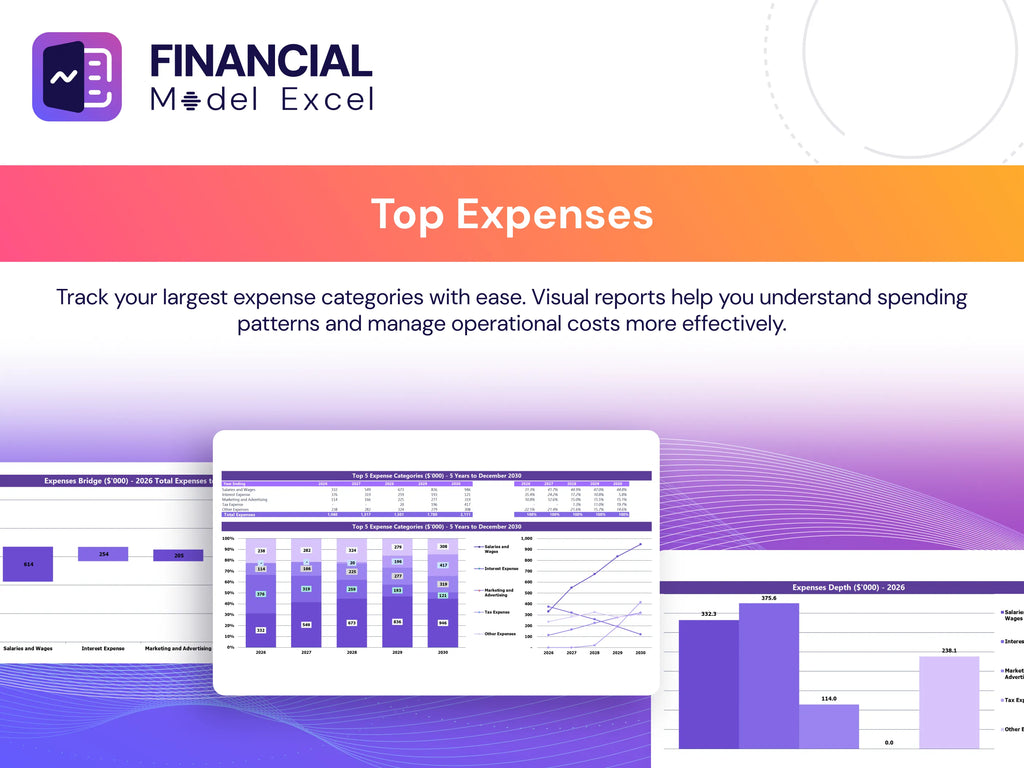
Business Top Expenses Spreadsheet
This financial model for your AR museum tour startup features a Top Expenses tab, highlighting the four largest operational cost categories alongside a consolidated ‘Other’ expenses section. This streamlined approach supports precise budget planning for AR museum tours, enabling clearer insights into your augmented reality museum tour expense forecasting and cost-benefit analysis. By focusing on key financial metrics, you can optimize your museum augmented reality pricing strategy, enhancing the financial viability and profitability model of your AR-enhanced tours.
AR ASSISTED MUSEUM TOURS FINANCIAL MODEL FINANCIAL PROJECTION EXPENSES
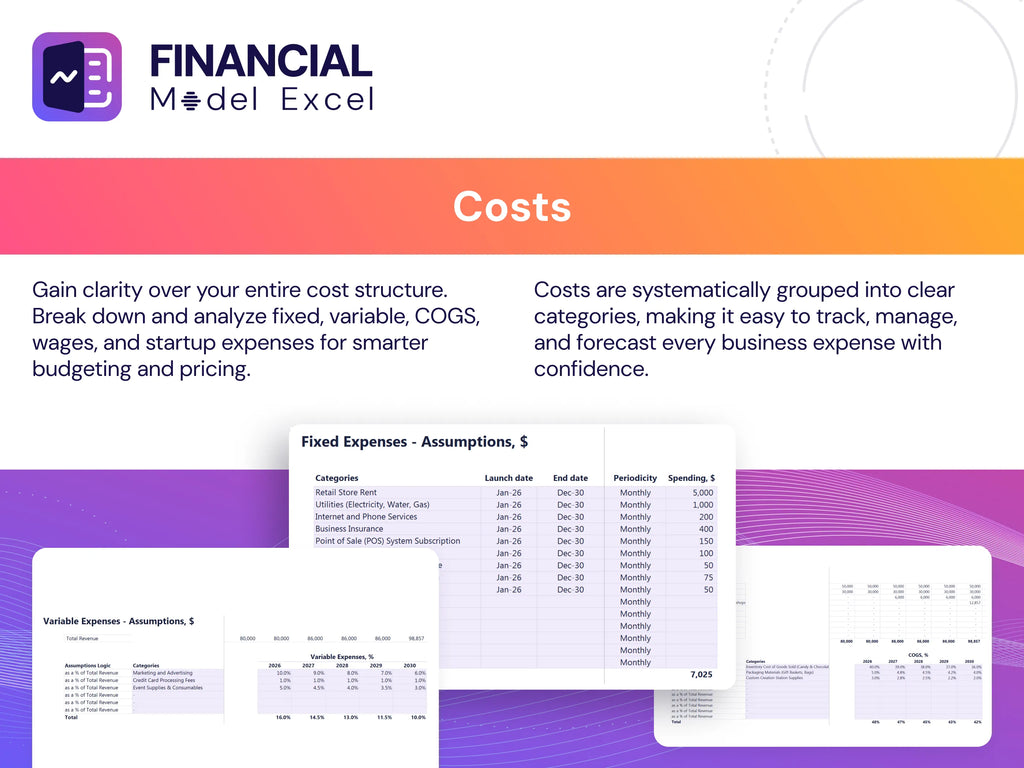
Costs
Our AR museum tour business plan features a robust financial forecasting model, enabling precise budget planning and expense forecasting for up to 60 months. Operational costs—including COGS, wages, and fixed or variable expenses—are meticulously categorized for accurate accounting treatment. Our user-friendly Excel template automates expense tracking and integrates dynamic expense forecasting curves, allowing customizable growth rates tied to revenue percentages or fixed schedules. This cost-benefit analysis supports financial viability and profitability modeling, empowering stakeholders to confidently evaluate investment models and revenue projections for AR-enhanced museum tours.
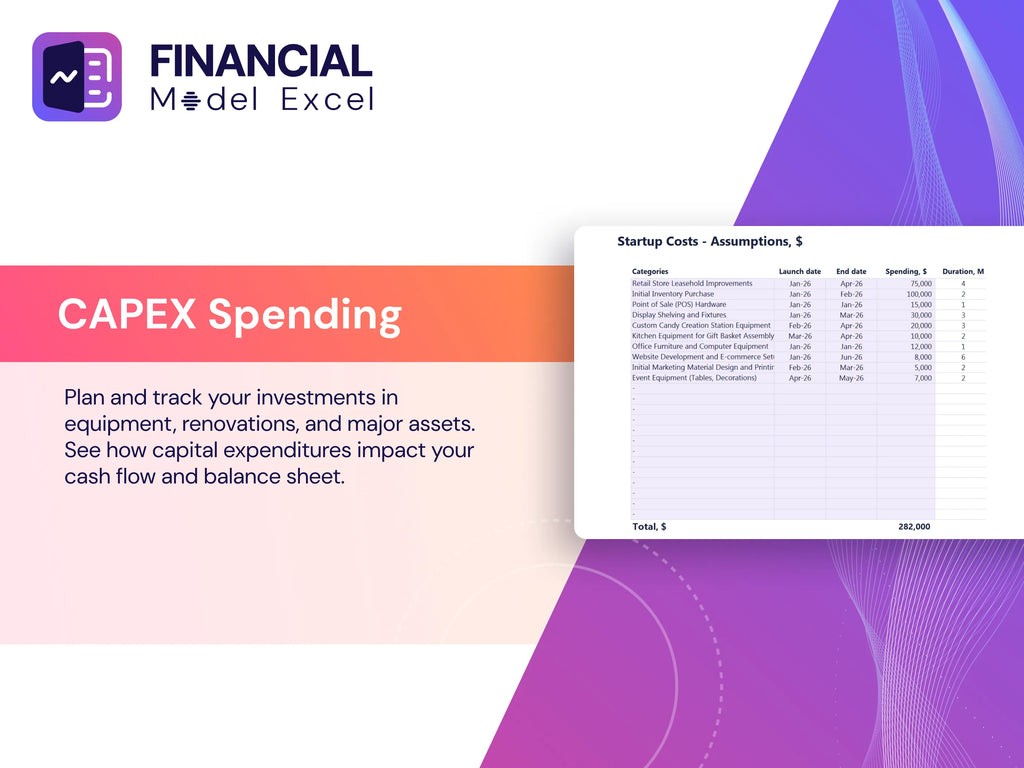
CAPEX Spending
The CAPEX forecast is a critical component of the AR museum tour business plan, serving as a key driver in financial forecasting for AR museum experiences. As one of the largest capital-intensive expenditures, it directly impacts the financial viability of AR museum tours and informs budget planning and expense forecasting. Analyzing historical CAPEX data within cash flow projections and pro forma balance sheets is essential for developing a robust investment model for AR enhanced tours. This ensures accurate cost-benefit analysis and supports strategic financial scenario planning to maximize long-term profitability and sustainable growth.
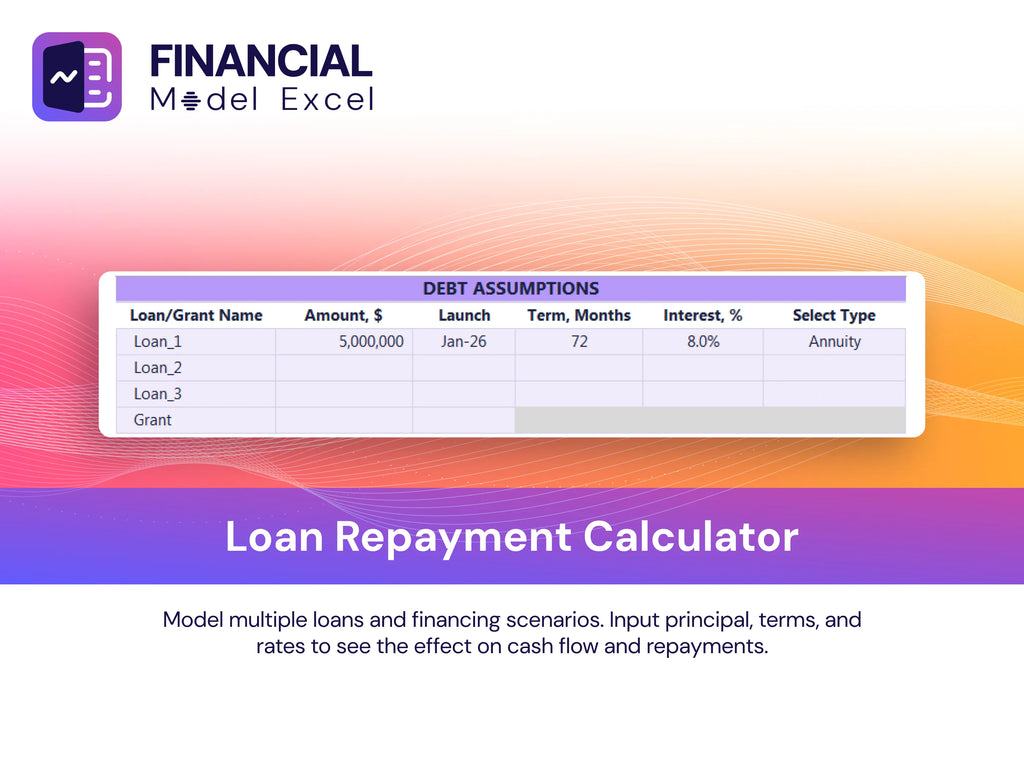
Loan Financing Calculator
Our AR museum tours financial model integrates embedded formulas within the loan amortization schedule, enabling precise expense forecasting and budget planning for AR museum tours. Easily distinguish between loan principal and interest payments, with automatic calculations of repayment amounts, payment frequency, and duration. This streamlined financial forecasting tool supports accurate cost-benefit analysis and enhances the financial viability assessment of AR museum experiences, empowering informed decision-making for investment and profitability planning within the augmented reality museum tour business plan.
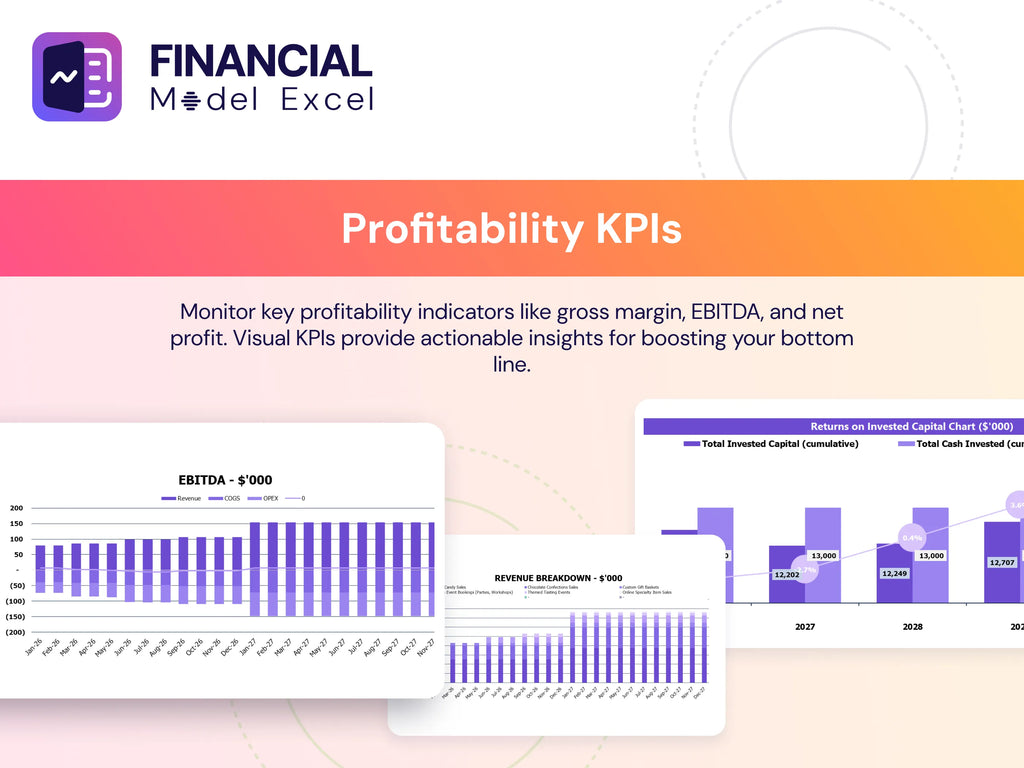
AR ASSISTED MUSEUM TOURS FINANCIAL MODEL EXCEL FINANCIAL MODEL METRICS
Financial KPIs
EBIT (Earnings Before Interest and Tax) is a critical financial metric integrated into the AR museum tour business plan’s financial model. It is calculated by deducting cost of sales and operating expenses—including AR museum tour operational costs and budget planning components—from total revenue. This metric provides essential insights into the financial viability and profitability of AR-enhanced tours, supporting accurate revenue projections, expense forecasting, and investment models. Incorporating EBIT ensures informed financial forecasting and scenario planning, enabling museums to optimize monetization models and pricing strategies for augmented reality experiences.
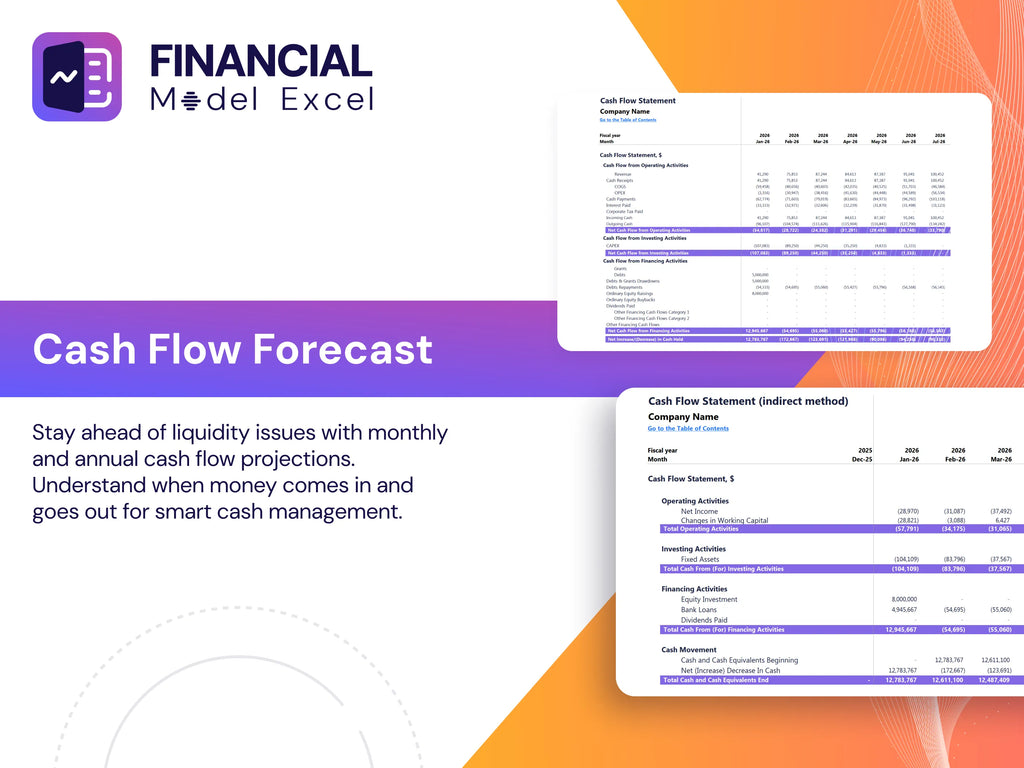
Cash Flow Forecast Excel
A robust cash flow projection template is essential in an AR museum tour business plan, as it highlights the financial viability of augmented reality experiences. This pro forma cash flow statement provides clear insights into revenue streams, operational costs, and investment returns, enabling effective budget planning and expense forecasting. Utilizing this template supports financial forecasting for AR museum experiences, helping to refine pricing strategies and optimize profitability models. Ultimately, it serves as a vital tool for demonstrating economic impact and securing funding by showcasing the expected cash inflows and outflows within AR-enhanced museum tours.
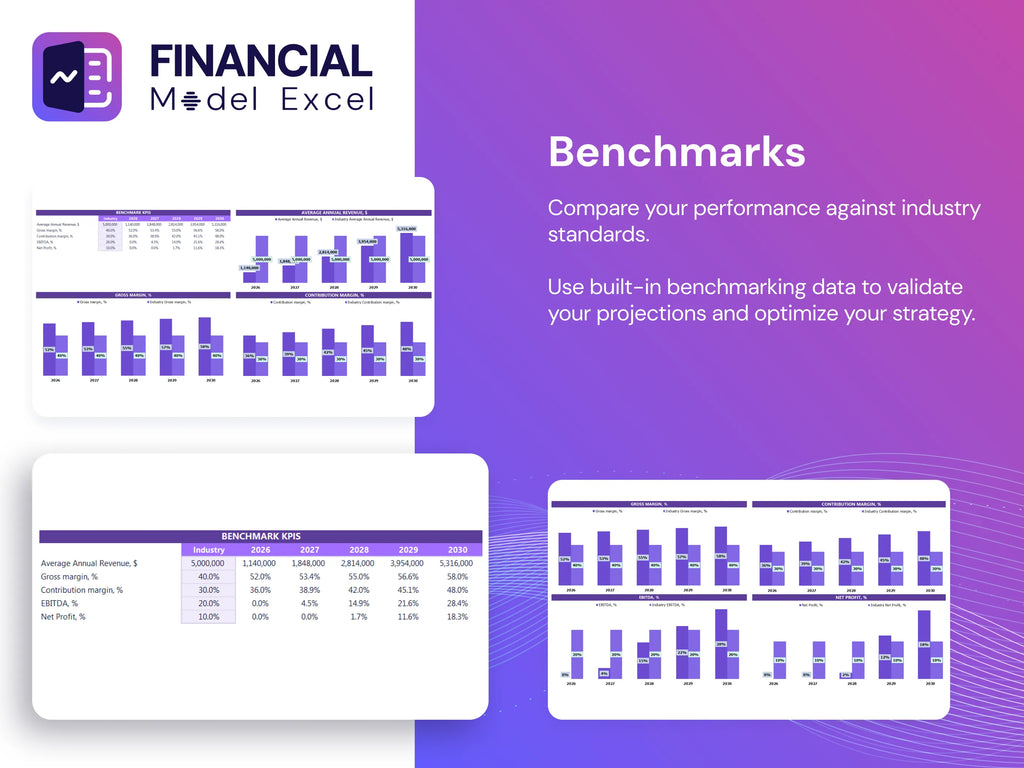
KPI Benchmarks
This financial model template includes a dedicated comparative analysis tab, benchmarking key financial metrics against industry peers specializing in AR-enhanced museum tours. By evaluating performance across comparable companies, it offers comprehensive insights into operational efficiency, revenue streams, and profitability. This robust analysis supports strategic financial forecasting, cost-benefit evaluation, and investment modeling, empowering stakeholders to optimize budget planning and maximize the financial viability and economic impact of augmented reality museum experiences.
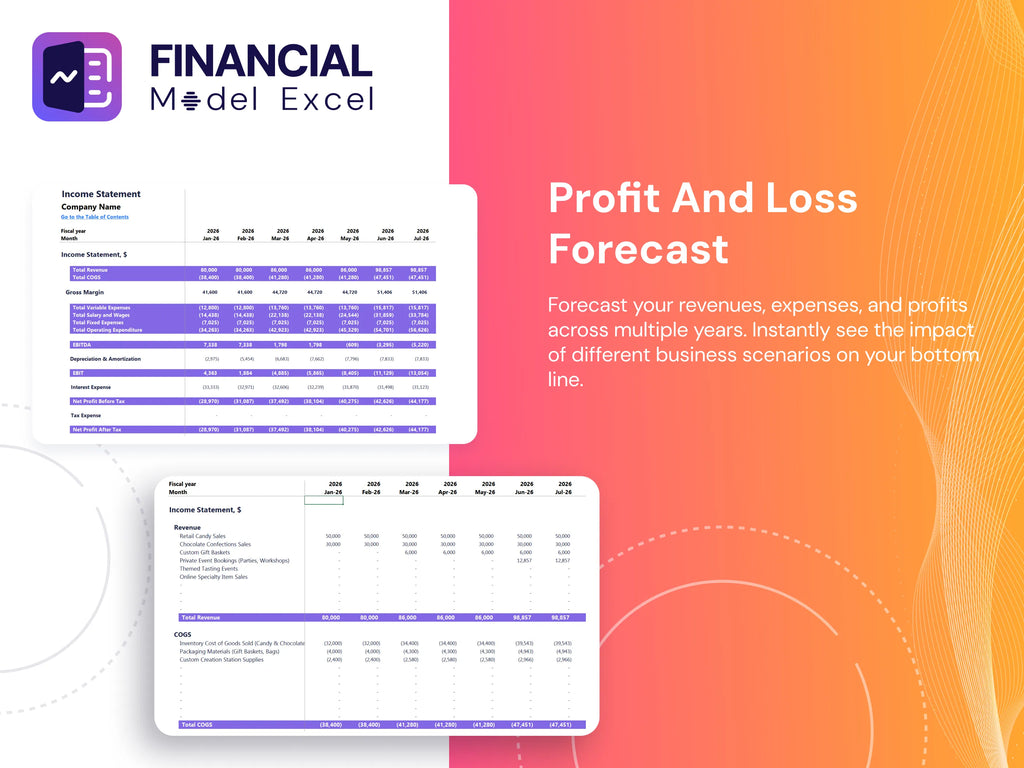
P&L Statement Excel
Maximize your AR museum tours’ financial success with our automated 5-year financial projection template. Designed for seamless budget planning and revenue projection, this tool simplifies complex expense forecasting and profit and loss analysis. Quickly evaluate the financial viability and operational costs of your augmented reality museum experiences, enabling informed decisions on pricing strategies and investment models. Streamline your financial scenario planning and unlock new AR experience revenue streams with confidence using our professional, easy-to-use Excel template.
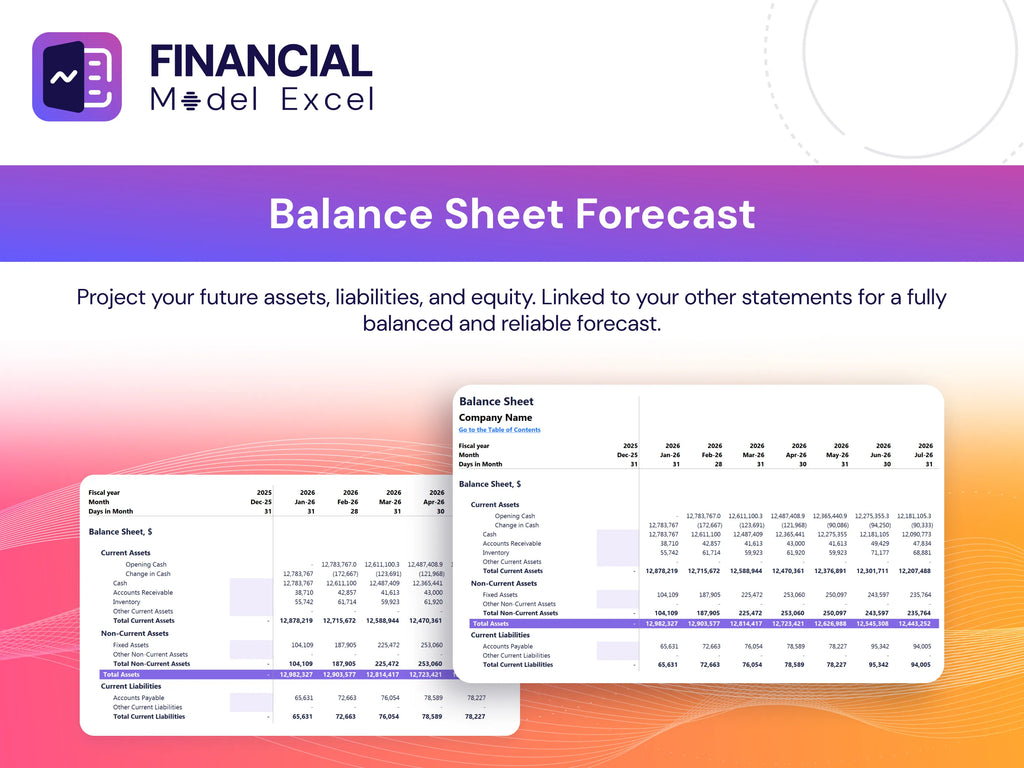
Pro Forma Balance Sheet Template Excel
Accurate financial forecasting is essential in an AR museum tour business plan, linking the pro forma balance sheet, income statement, and cash flow projections. While investors focus on income statements, reliable balance sheet forecasts enhance cash flow analysis—key for assessing the financial viability of AR museum tours. These projections also enable evaluation of profitability metrics such as return on equity and return on invested capital, supporting informed decisions on investment models and pricing strategies. Integrating comprehensive expense forecasting and revenue projections ensures a robust financial scenario plan, maximizing the economic impact and long-term profitability of augmented reality museum experiences.
AR ASSISTED MUSEUM TOURS FINANCIAL MODEL FINANCIAL PROJECTION TEMPLATE VALUATION
Startup Valuation Model
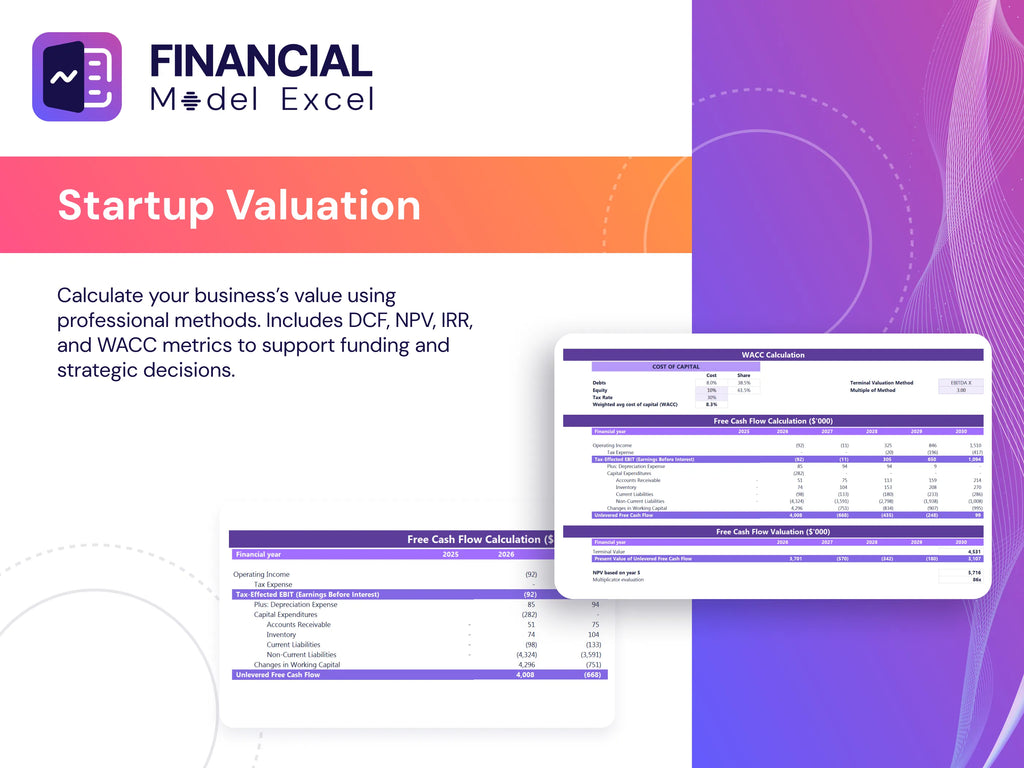
The seed valuation worksheet integrates key financial metrics—Weighted Average Cost of Capital (WACC), Discounted Cash Flows (DCF), and Free Cash Flows (FCF)—to drive robust financial forecasting for AR museum experiences. WACC reflects the blended cost of capital, balancing equity and debt, serving as a critical risk gauge for lenders. Meanwhile, DCF analysis quantifies the present value of future cash flows, underpinning investment decisions within an AR museum tour business plan. Together, these tools provide a comprehensive framework for assessing the financial viability and return on investment of AR-enhanced museum tours.
Cap Table
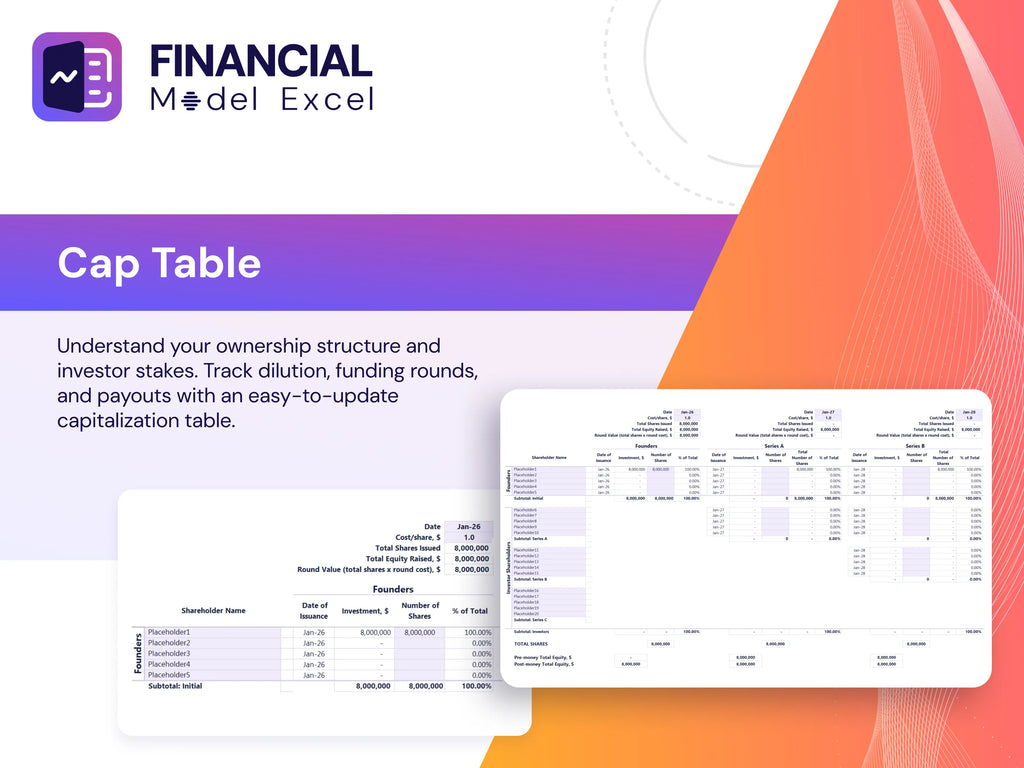
Utilizing a pro forma cap table is essential for financial forecasting and investment modeling in AR museum tours. It meticulously tracks securities—common and preferred stock, warrants, and options—alongside investor shareholdings, providing transparency and control over capital structure. This precision supports accurate budget planning for AR museum tour operational costs and enhances the financial viability and profitability model of augmented reality museum experiences. Informed insight into where funds are allocated drives effective cost-benefit analysis and strengthens revenue projection accuracy, ultimately boosting the return on investment and long-term success of AR-enhanced museum tours.
AR ASSISTED MUSEUM TOURS 3 STATEMENT FINANCIAL MODEL EXCEL TEMPLATE ADVANTAGES
The 5-year AR museum financial model ensures precise budget tracking for optimized spending and maximized tour profitability.
The AR-assisted museum tours financial model optimizes revenue streams while minimizing expenses for maximum profitability.
Run two valuation methods to maximize accuracy and boost financial forecasting for AR-assisted museum tours.
Easily forecast cash flow and maximize profits with our AR-assisted museum tours financial model and projection template.
Our AR museum tour financial model ensures optimized cash flow for seamless supplier payments and staff salaries.
AR ASSISTED MUSEUM TOURS FINANCIAL PROJECTION STARTUP ADVANTAGES
Our AR museum tour financial model ensures precise revenue projections and maximizes your investment return—because we do the math.
Streamline AR museum tour financial forecasting with our ready-to-use model—no programming or costly consultants needed.
Our AR museum tour financial model ensures accurate revenue projections and maximizes profitability through strategic cost analysis.
Deliver a dynamic 5-year AR museum tours financial model enabling precise forecasting, profitability insights, and strategic investment decisions.
Get a robust financial model to accurately forecast AR museum tour revenue, costs, and maximize profitable investment returns.
This robust AR museum tours financial model ensures accurate revenue projection and optimal investment for maximizing profitability.
Our AR museum tour financial model ensures clear revenue projections, proving reliable loan repayment and investment confidence.
Financial forecasting for AR museum tours strengthens loan applications by clearly demonstrating repayment ability and profitability potential.
The AR museum tour profitability model enables precise financial forecasting, maximizing revenue and optimizing investment returns efficiently.
The financial model enables dynamic adjustments for accurate AR museum tour revenue projections and optimized profitability management.


