


Interactive Hiking Map App Financial Model

5-Year Financial Projections
100% Editable
Investor-Approved Valuation Models
MAC/PC Compatible, Fully Unlocked
No Accounting Knowledge Needed
Interactive Hiking Map App Financial Model
Bundle Includes:
-
 Financial Model
-
 Business Plan
-
 Pitch Deck
-
 Financial Dashboard


ALL IN ONE MEGA PACK - CONSIST OF:
Interactive Hiking Map App Financial Model/Business Plan Excel Template
Pitch Deck Template For PowerPoint, Keynote & Google Slides
Business Plan Guide and Business Plan Template in MS Word Format
Financial Dashboard in Excel To Track Your Business Performance
INTERACTIVE HIKING MAP APP FINANCIAL MODEL FOR STARTUP INFO
Highlights
Generate a comprehensive 5-year financial model for your interactive hiking map app, complete with cash flow projections, a financial dashboard, and key financial KPIs aligned with GAAP/IFRS standards. This robust startup pro forma template provides detailed financial assumptions for the app business model, including revenue streams, cost structure of app development, operational expenses, and monetization strategies for hiking apps. Utilize the model for accurate financial forecasting, investment analysis, break-even analysis, and profitability forecasts, ensuring solid planning for interactive map app scalability and user engagement growth. Access an unlocked, fully editable Excel template designed to support app subscription financial models and incorporate interactive hiking map user analytics, empowering you to perform thorough app cost-benefit analysis and identify optimal funding sources before committing to purchase.
The ready-made interactive hiking map app financial model Excel template effectively relieves common pain points by offering a comprehensive, scalable solution tailored to hiking app development, allowing users to easily modify key financial assumptions such as operational expenses, growth rates, and revenue streams including monetization strategies and subscription models. This eliminates the need for costly financial analysts or complex startup cost spreadsheets, as it integrates detailed cost structure breakdowns, break-even analysis, and profitability forecasts that automatically update projections across all sheets. By incorporating interactive map app user engagement metrics and hiking app revenue streams into financial KPIs, the model supports precise financial forecasting for mobile apps, enabling investors and entrepreneurs to perform robust investment analysis and cost-benefit evaluations with accuracy and efficiency.
Description
The interactive hiking map app financial model integrates key financial KPIs for mobile apps with detailed cost structure of app development, covering hiking app operational expenses and investment analysis for hiking apps to deliver a comprehensive profitability forecast for hiking apps. Built to support financial forecasting for mobile apps, it includes break-even analysis for app projects and app subscription financial model options to optimize monetization strategies for hiking apps. The model leverages interactive hiking map user analytics and market trends to enhance interactive map app user engagement insights, ensuring scalability and aligning with interactive map app funding sources. By incorporating financial assumptions for app business model and app cost-benefit analysis, this financial projections for startups tool enables clear visualization of hiking app revenue streams, facilitating sound financial planning, company valuation, and effective utilization of funds.
INTERACTIVE HIKING MAP APP FINANCIAL MODEL FINANCIAL MODEL REPORTS
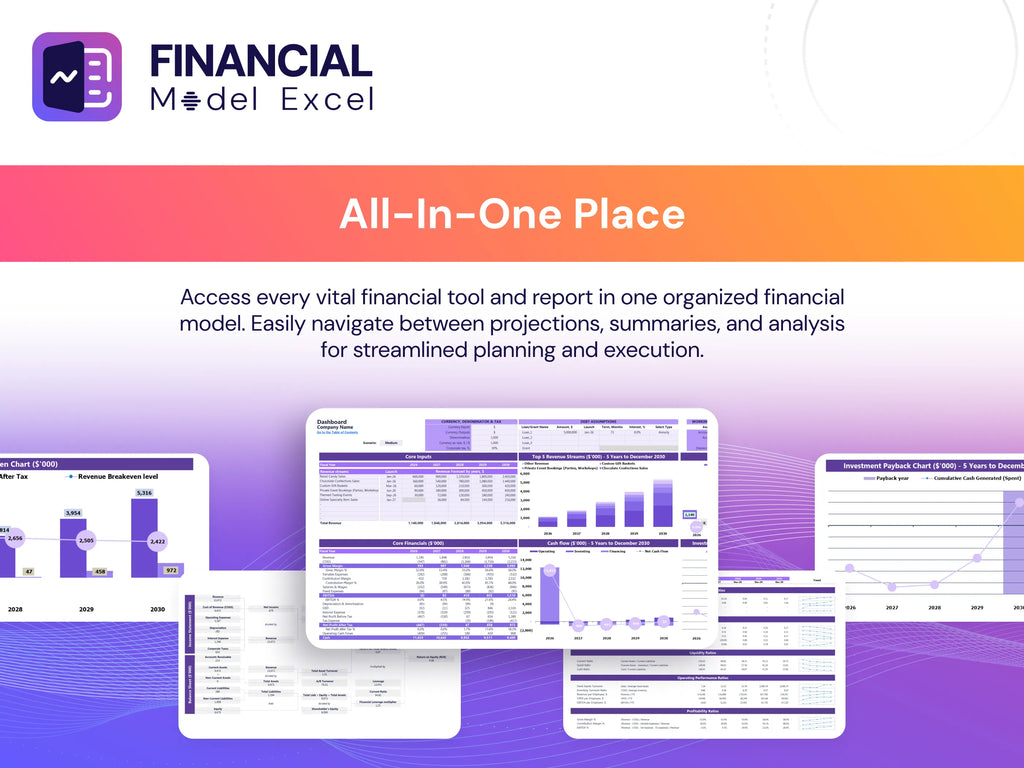
All in One Place
Unlock a fully customizable, user-friendly proforma business plan template designed for interactive hiking map app development. Our comprehensive three-statement financial model offers detailed financial projections, incorporating key financial KPIs, cost structure, and monetization strategies for hiking apps. Tailor every sheet to fit your unique assumptions, optimizing profitability forecasts and operational expense analysis. Perfect for financial forecasting, break-even analysis, and investment analysis, this model empowers startups to navigate market trends and enhance user engagement through data-driven insights. Elevate your app’s scalability and funding strategy with a powerful tool built for success in the interactive map app space.
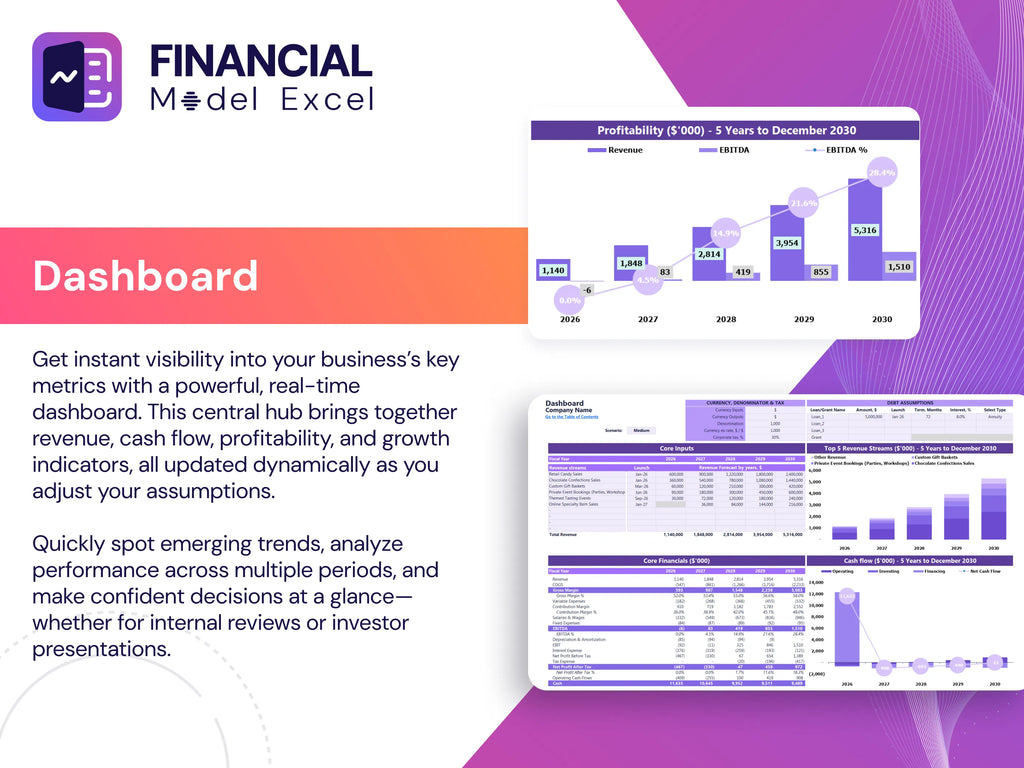
Dashboard
The financial Excel template is an essential resource for hiking app developers, enabling detailed financial forecasting for mobile apps. It offers comprehensive cash flow and pro forma balance sheet analysis with customizable timeframes—monthly or yearly. Its intuitive dashboard delivers clear visual summaries of key financial KPIs, supporting investment analysis for hiking apps and cost structure evaluation. This tool empowers businesses to model profitability forecasts, conduct break-even analysis, and refine monetization strategies, enhancing interactive hiking map app scalability and user engagement. Ideal for startups seeking accurate financial projections and informed decision-making in a competitive market.
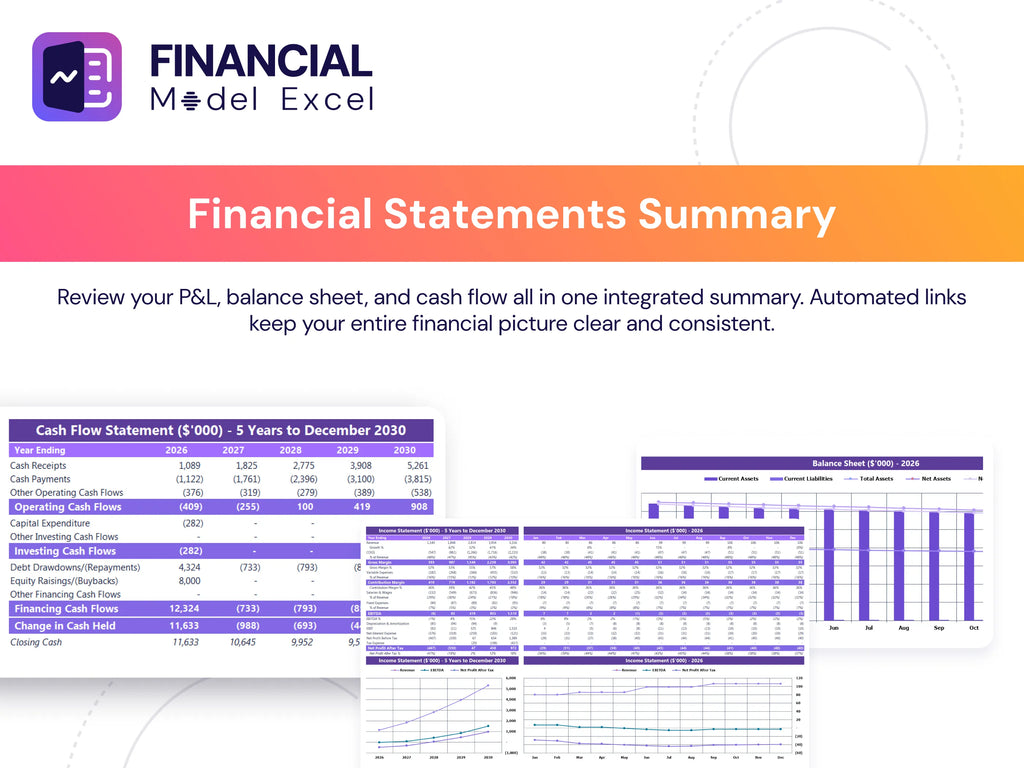
Business Financial Statements
Our startup cost template offers an all-in-one financial model for app development, integrating P&L forecasts, pro forma balance sheets, and cash flow projections—available monthly or annually. Designed for hiking app startups, it supports seamless integration with QuickBooks, Xero, FreshBooks, and other accounting software, enhancing financial forecasting for mobile apps. This flexible model empowers founders to perform investment analysis, break-even analysis, and monitor financial KPIs, driving accurate profitability forecasts and informed monetization strategies for hiking apps. Elevate your interactive hiking map app’s financial planning with robust, data-driven tools tailored to market trends and user engagement analytics.
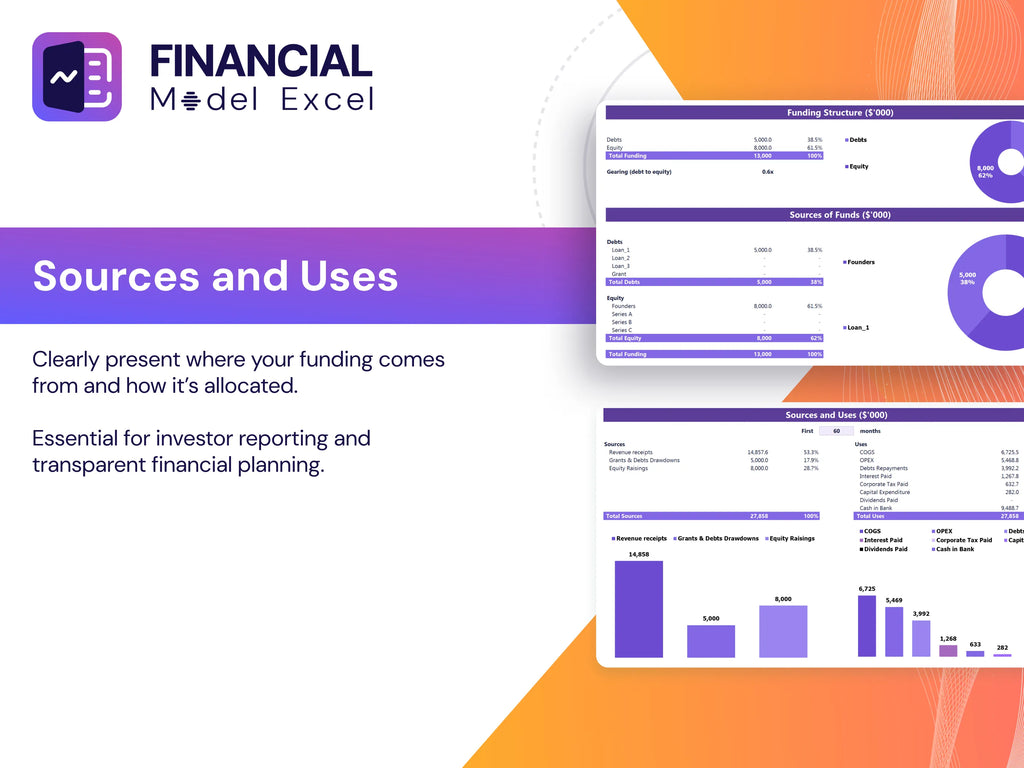
Sources And Uses Statement
The sources and uses of funds statement provides a clear overview of capital inflows and outflows, ensuring total sources align with total uses. This financial report is essential for hiking app startups to support investment analysis, optimize funding sources, and accurately forecast profitability. It plays a critical role in app development financial modeling, guiding decisions around operational expenses, monetization strategies, and scalability. Key during recapitalization, restructuring, or mergers & acquisitions, this statement empowers stakeholders to assess the cost structure and project break-even points, driving informed financial forecasting and strategic growth in the interactive hiking map app market.
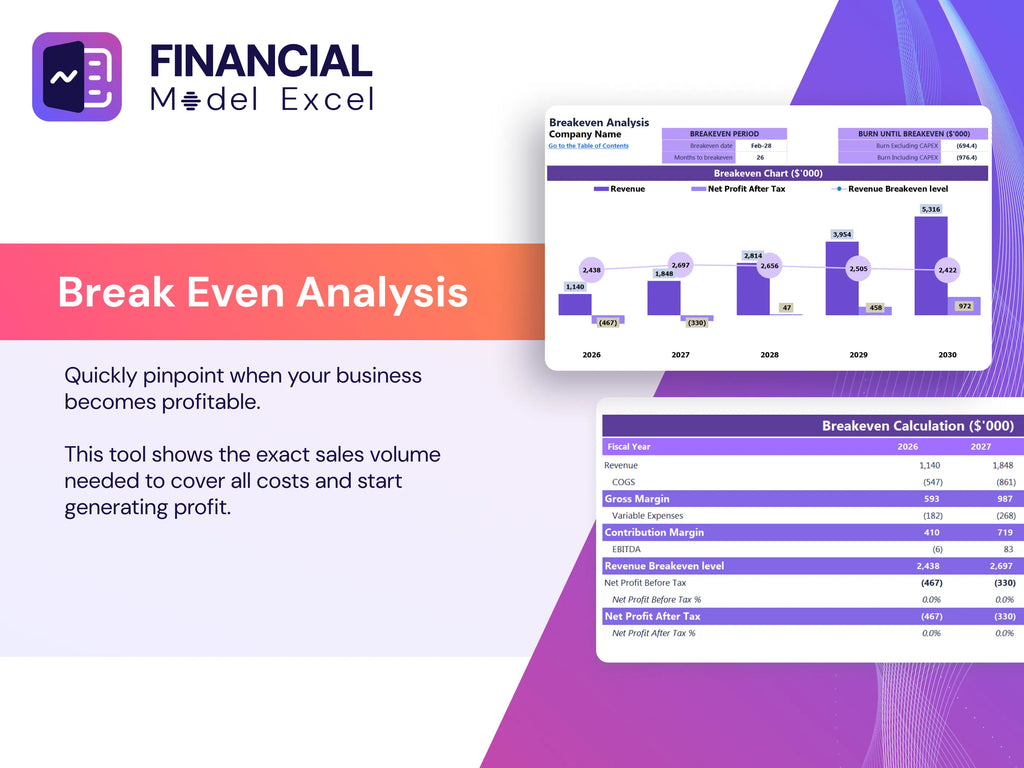
Break Even Point In Sales Dollars
Our feasibility study template seamlessly integrates with your Excel financial reports to automate break-even analysis for your hiking app project. It calculates break-even sales, units, and ROI, providing clear insights into profitability timelines. Leveraging this tool supports accurate financial forecasting for mobile apps, enabling informed investment analysis and strategic planning around cost structure and operational expenses. Optimize your app development financial model and confidently project revenue streams using actionable break-even data tailored for interactive hiking map app ventures.
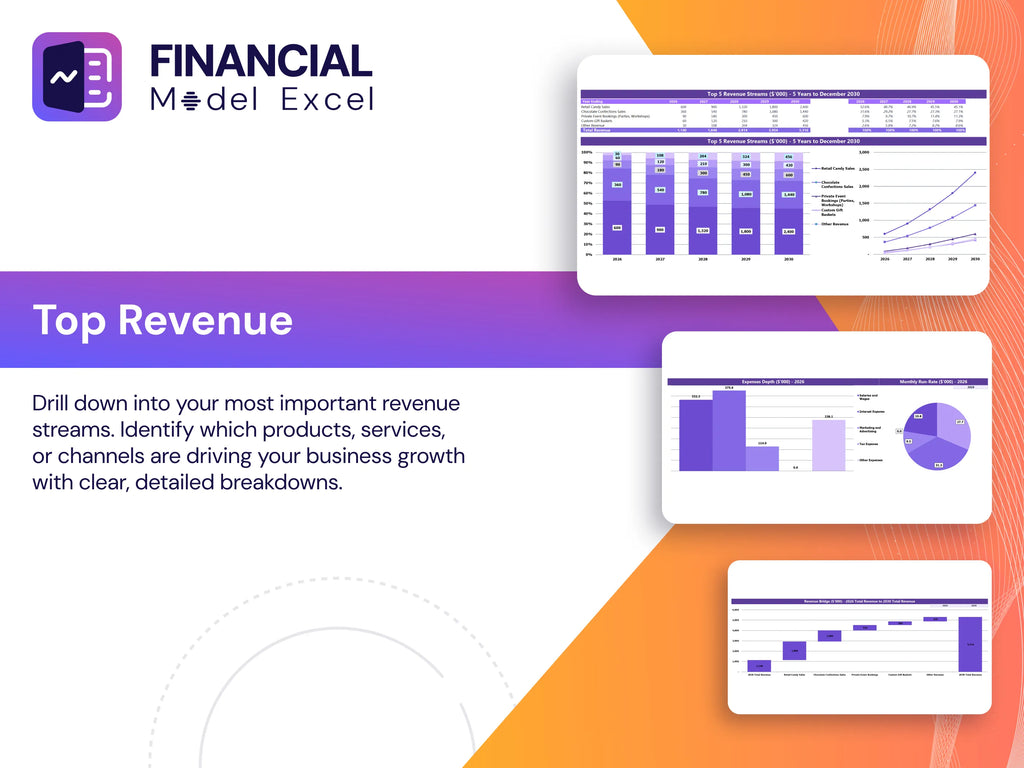
Top Revenue
This financial Excel template features a dedicated tab for in-depth analysis of the company’s hiking app revenue streams. It clearly breaks down income by product and service categories, enabling precise financial forecasting for mobile apps. Ideal for investment analysis and profitability forecasts, this tool supports effective monetization strategies for hiking apps. By integrating interactive hiking map app user analytics, it empowers startups to optimize their cost structure and operational expenses, ensuring a comprehensive financial model for app development and scalable growth.
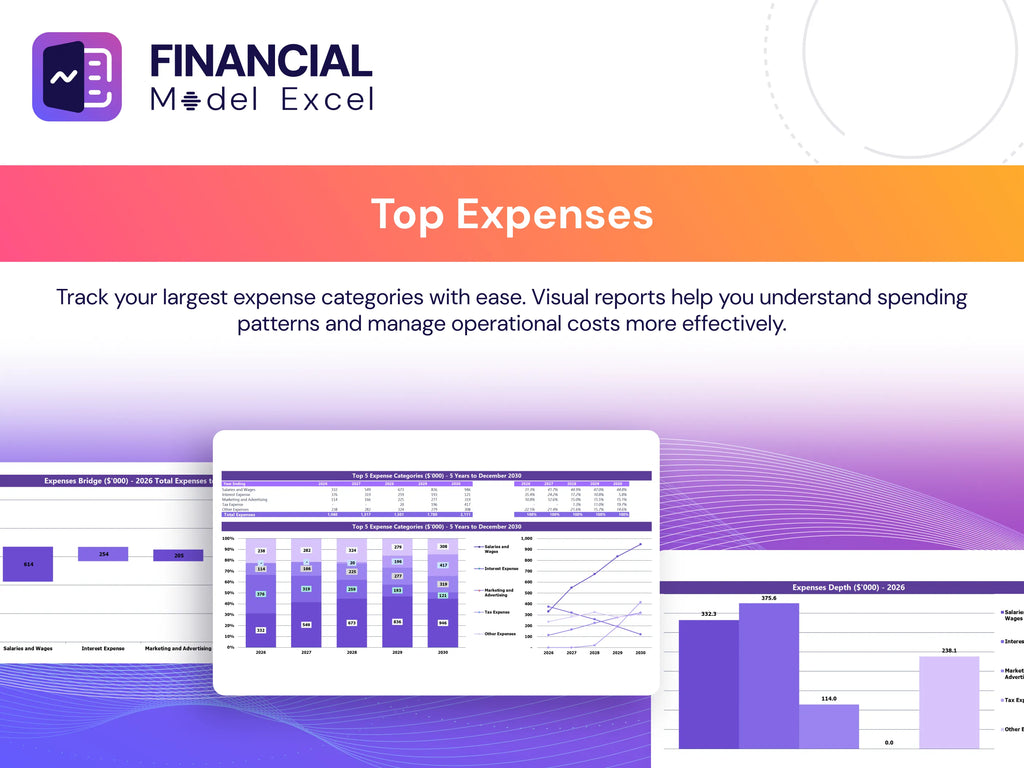
Business Top Expenses Spreadsheet
To maximize profitability in hiking app development, it’s crucial to analyze the cost structure and optimize operational expenses strategically. Our financial model features a dedicated top expenses tab that highlights the four largest costs, with others grouped under “Other,” enabling quick visibility. This streamlined approach supports effective financial forecasting for mobile apps and informed investment analysis. Both startups and established companies benefit from monitoring interactive hiking map app user engagement and leveraging these insights to implement cost-saving strategies, enhance monetization, and ensure sustainable growth and profitability.
INTERACTIVE HIKING MAP APP FINANCIAL MODEL FINANCIAL PROJECTION EXPENSES
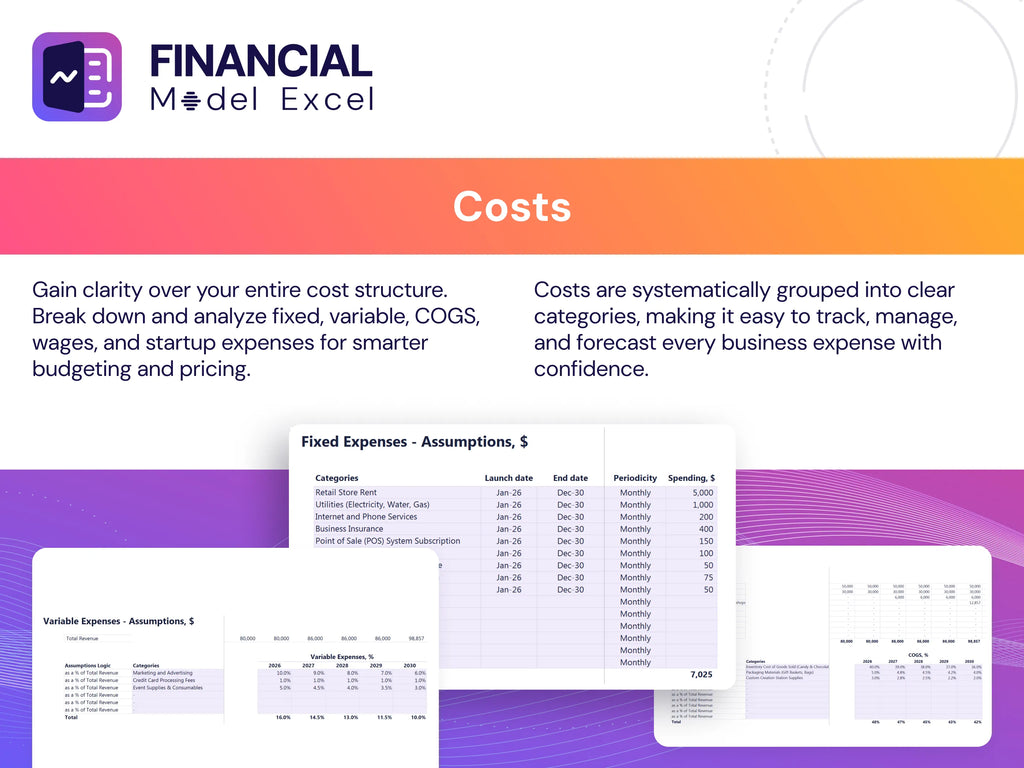
Costs
Effective management of hiking app operational expenses is crucial during the early stages to ensure financial stability. Utilizing our financial projections template, which incorporates a comprehensive financial model for app development, entrepreneurs can monitor costs, funding sources, and key financial KPIs for mobile apps. This proactive approach supports accurate financial forecasting for mobile apps, helping to avoid underfunding and control cost structure of app development. By leveraging financial assumptions for app business model and break-even analysis for app projects, founders can optimize monetization strategies for hiking apps and drive profitability forecast for hiking apps with confidence.
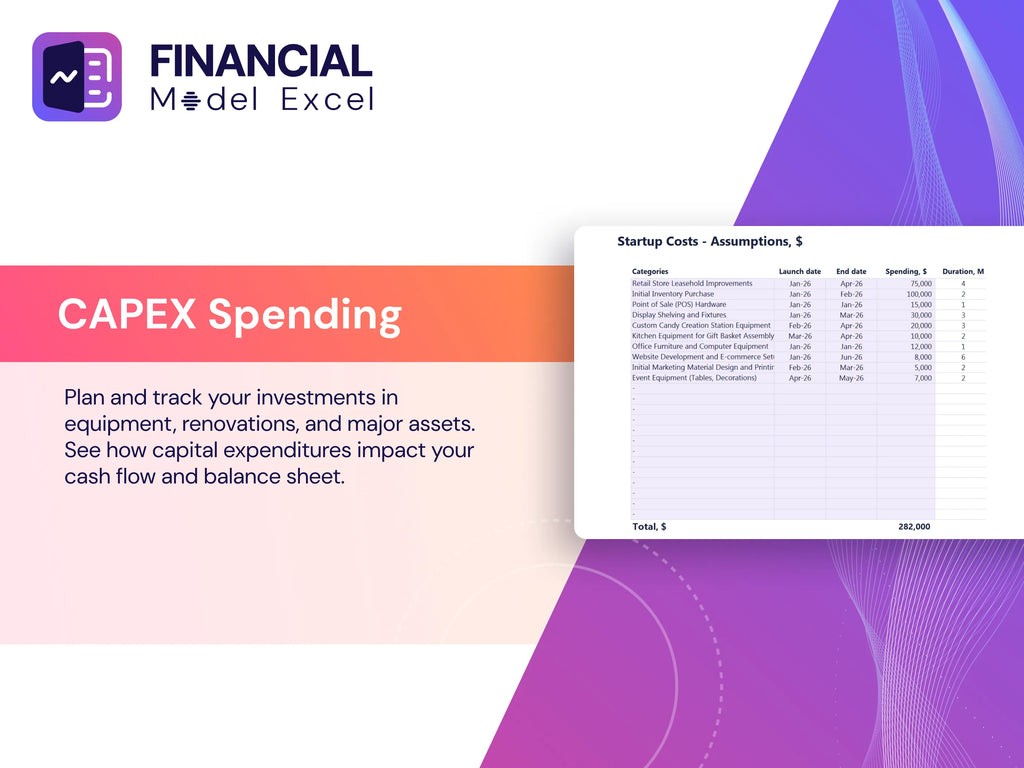
CAPEX Spending
Capital expenditure (CapEx) is a crucial component in financial forecasting for mobile apps, particularly in the interactive hiking map app market. It encompasses funds allocated to acquire, upgrade, and maintain physical assets like property, plants, or equipment (PPE). Accurate CapEx forecasting not only supports cost structure planning and depreciation management but also informs investment analysis and break-even assessments. Incorporating CapEx into your financial model for app development ensures a comprehensive view of operational expenses and profitability forecasts, enabling effective monetization strategies and scalable growth in the competitive hiking app landscape.
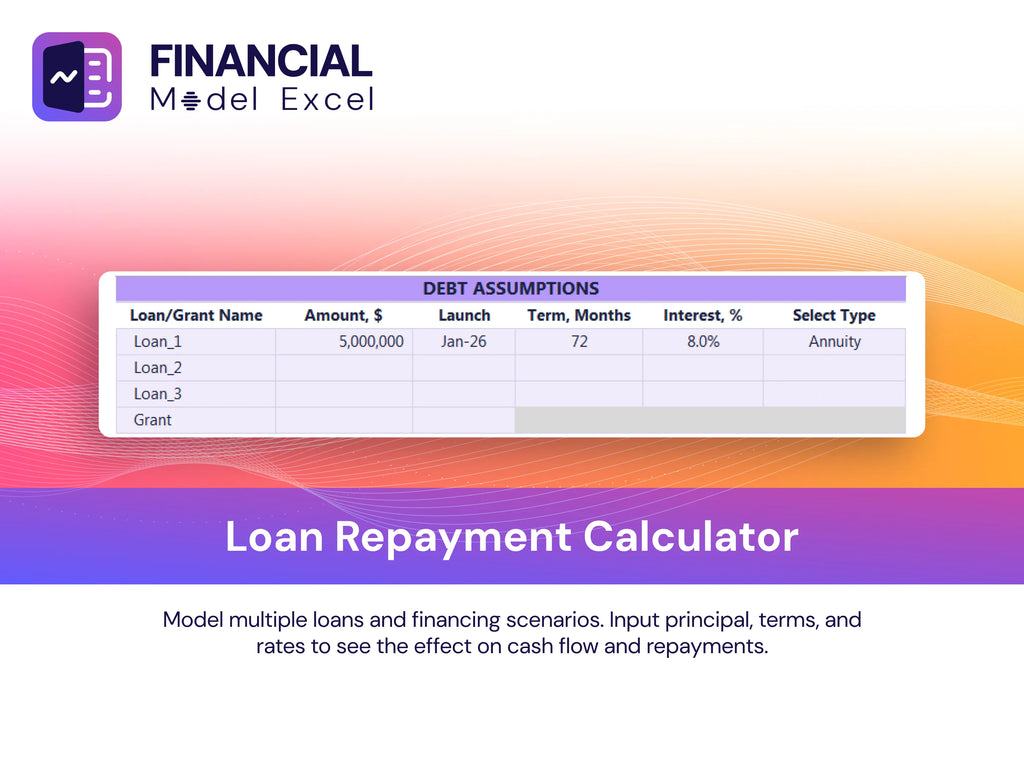
Loan Financing Calculator
Our comprehensive financial model for app development includes a dynamic loan amortization schedule, detailing both principal and interest calculations. This tool accurately forecasts payment amounts by integrating key financial assumptions such as loan principal, interest rate, loan duration, and payment frequency. Designed to support investment analysis and profitability forecasts for hiking apps, it empowers startups with precise financial projections and break-even analysis, ensuring informed decisions on cost structure and operational expenses. Elevate your interactive hiking map app’s financial planning with this essential component, aligning with market trends and optimizing monetization strategies for sustainable growth.
INTERACTIVE HIKING MAP APP FINANCIAL MODEL EXCEL FINANCIAL MODEL METRICS
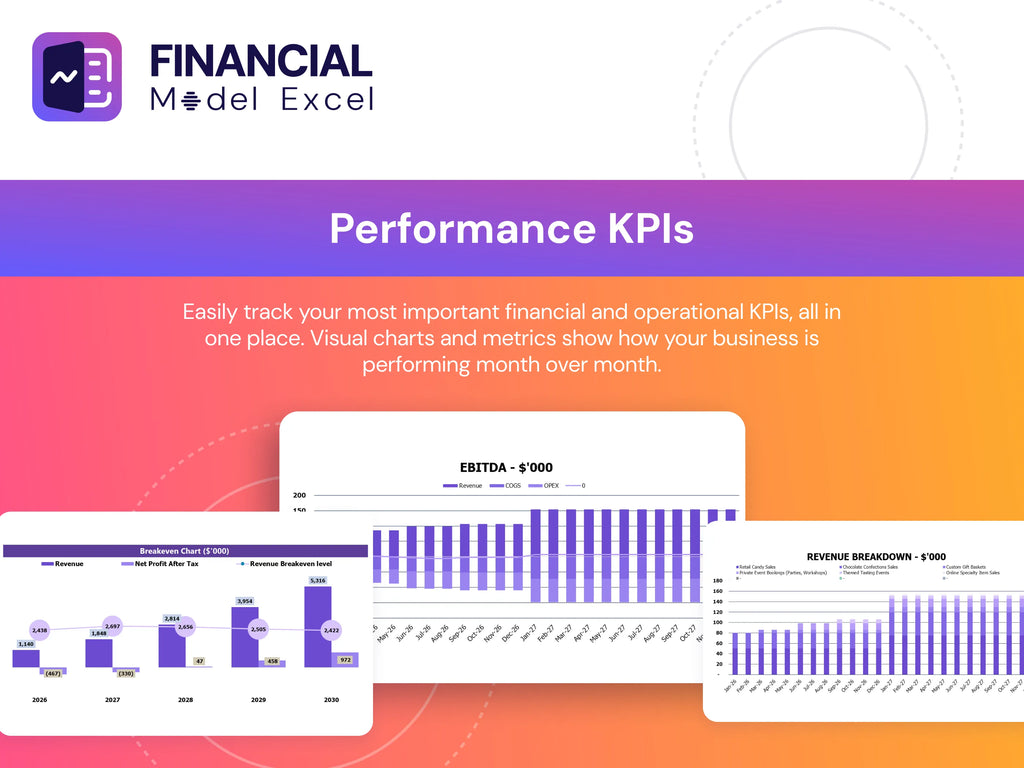
Financial KPIs
Gross Profit Margin (GPM) is a vital financial KPI that signals a business's fiscal health by measuring the gap between sales revenue and direct sales expenses. An improving GPM indicates effective cost management within the app’s cost structure and increasing revenue streams, crucial for financial forecasting for mobile apps. For hiking apps, tracking GPM supports investment analysis and profitability forecasts, helping refine monetization strategies and optimize operational expenses. Understanding this margin empowers startups to perform accurate break-even analysis and strengthen financial projections, ensuring sustainable growth in the competitive interactive hiking map app market.
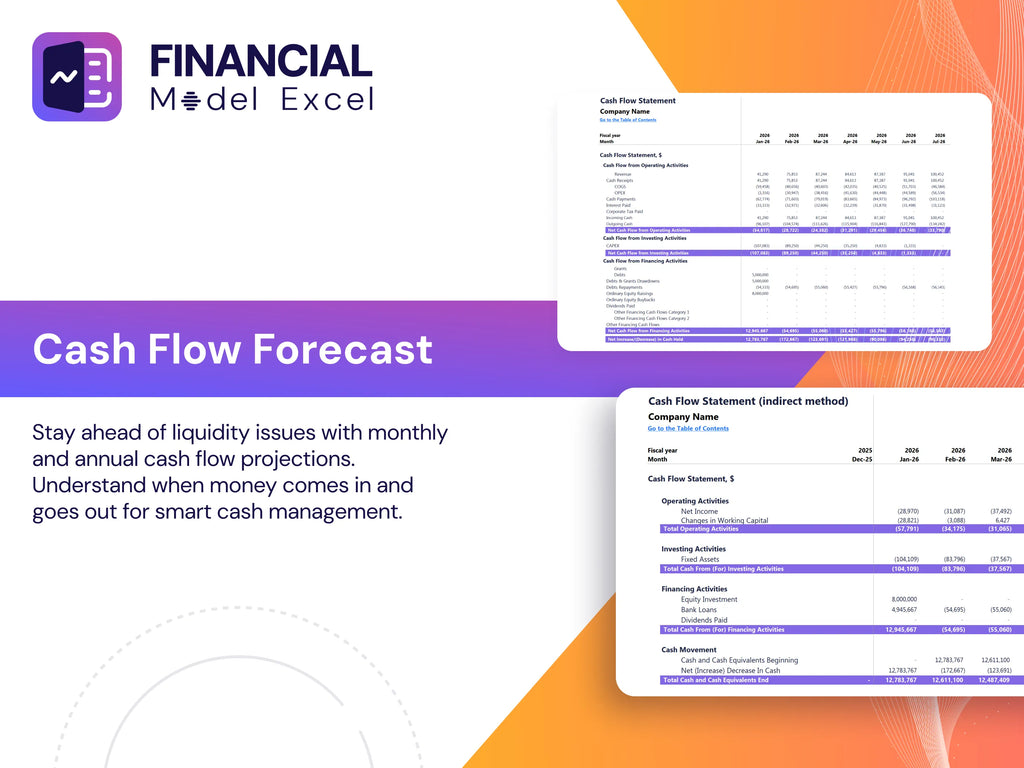
Cash Flow Forecast Excel
In developing a financial model for app development, the cash flow forecast is a critical component. This interactive map app financial projection tracks operating, investing, and financing cash flows, directly impacting the 5-year profitability forecast for hiking apps. Accurate cash flow analysis ensures alignment with the projected balance sheet and supports effective financial forecasting for mobile apps. Integrating this data enhances investment analysis, break-even analysis, and overall app subscription financial models, driving informed decisions on hiking app revenue streams and operational expenses while optimizing monetization strategies and scalability based on interactive hiking map user analytics.
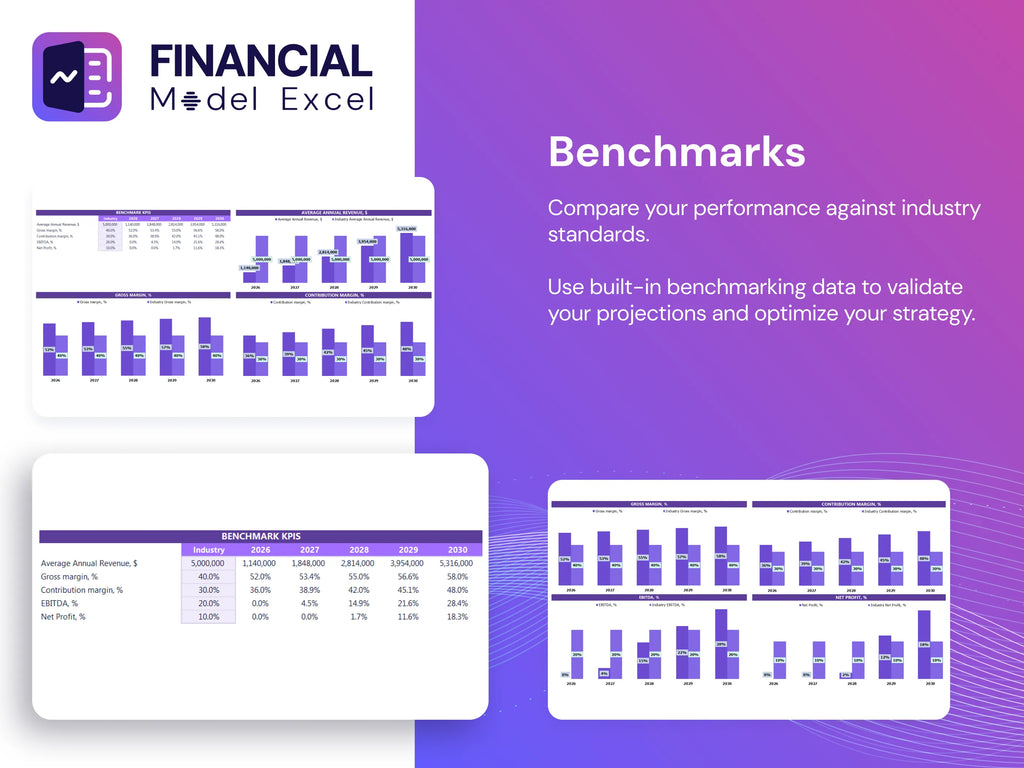
KPI Benchmarks
The pro forma financial statements template integrates key financial KPIs and operational metrics, benchmarking them against industry averages. This interactive hiking map app financial model offers vital insights into market trends, cost structure, and revenue streams, enabling precise financial forecasting for mobile apps. By leveraging benchmarking analysis, startups gain clarity on profitability forecasts, break-even points, and scalable monetization strategies. Such investment analysis and financial projections empower developers to align assumptions with best practices, optimize operational expenses, and enhance user engagement through refined app features—ensuring a data-driven path to sustainable growth and funding success in the competitive hiking app market.
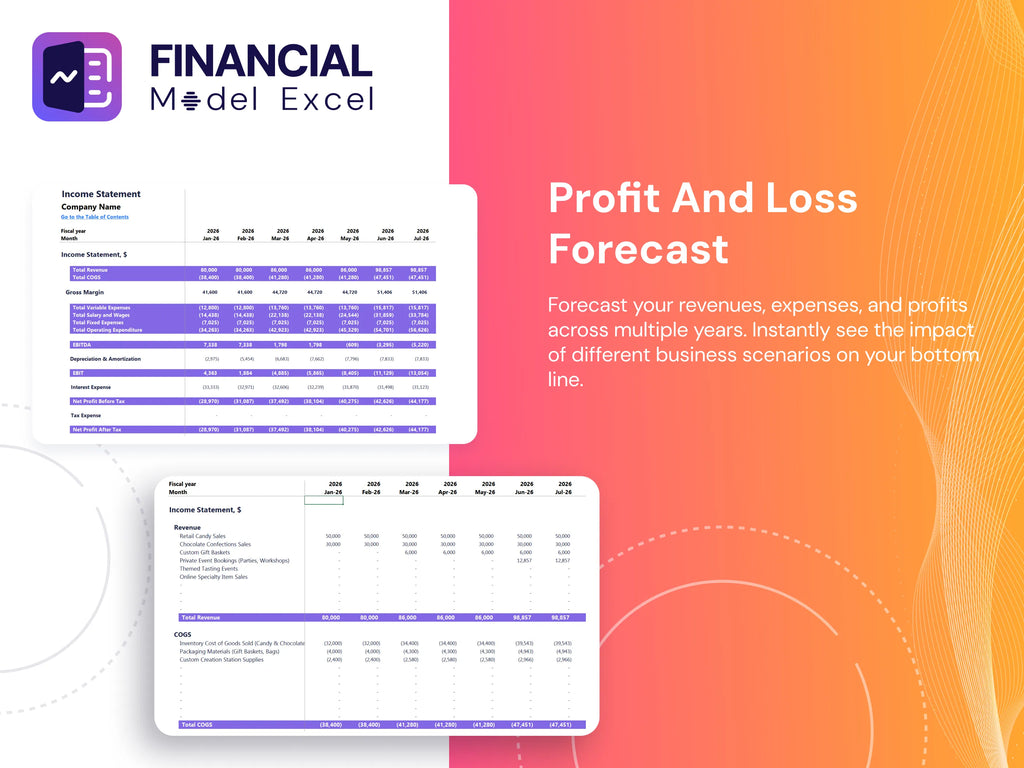
P&L Statement Excel
The interactive hiking map app financial model offers a comprehensive profit and loss forecast, essential for evaluating revenue streams and operational expenses over time. Featuring detailed 5-year monthly and yearly projections, it provides clear insights into profitability forecasts, key financial KPIs, and cost structures. This model supports investment analysis and break-even assessments, incorporating assumptions and ratios to guide monetization strategies and scalability planning. With visual graphs and user engagement metrics, it empowers stakeholders to make informed decisions based on thorough financial forecasting and cost-benefit analysis for sustainable app development success.
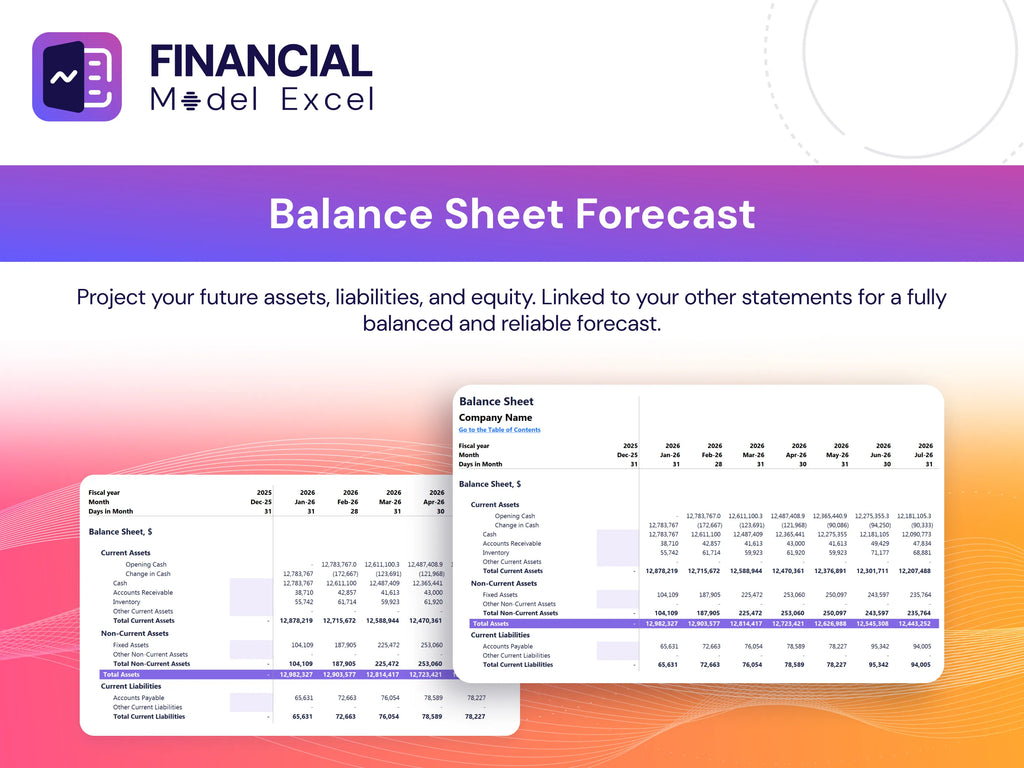
Pro Forma Balance Sheet Template Excel
A projected balance sheet template offers a clear snapshot of your startup’s assets, liabilities, and equity over a defined period. This essential financial report aids in investment analysis for hiking apps by detailing your app’s financial position and supporting financial forecasting for mobile apps. Utilize our template to assess your app’s cost structure, operational expenses, and profitability forecast, enabling informed decisions through accurate financial assumptions for your app business model. Perfect for startups, it enhances your break-even analysis and investment strategy, ensuring your interactive hiking map app scales effectively while tracking crucial financial KPIs.
INTERACTIVE HIKING MAP APP FINANCIAL MODEL FINANCIAL PROJECTION TEMPLATE VALUATION
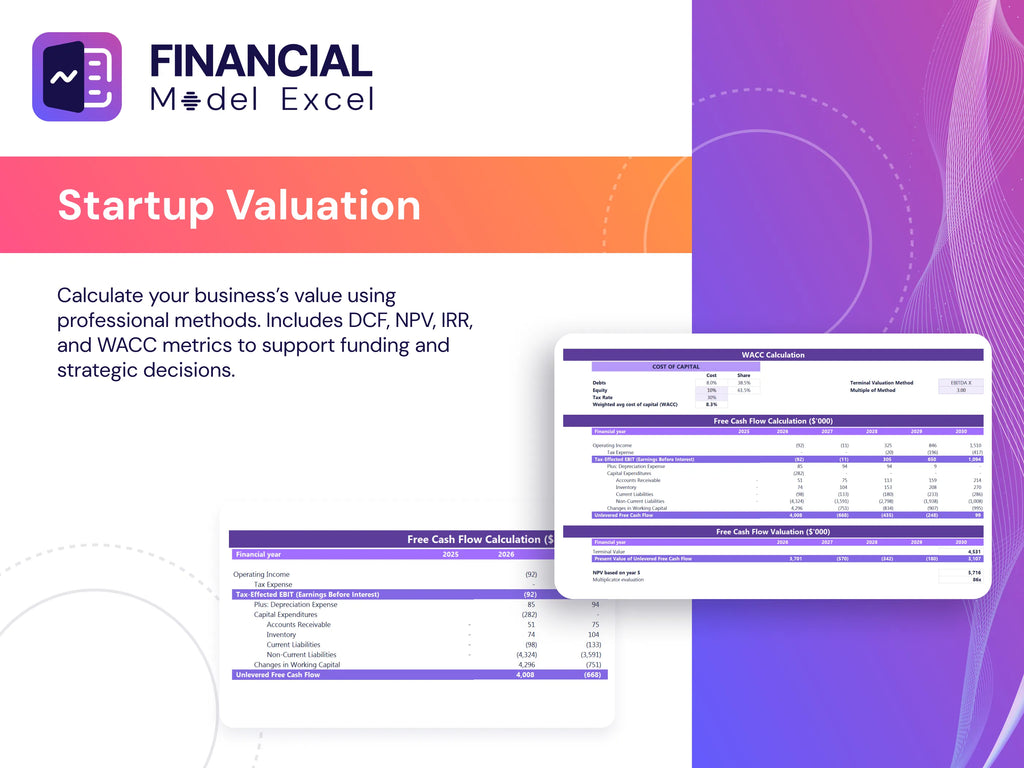
Startup Valuation Model
Leverage this comprehensive 5-year financial projection template to perform a Discounted Cash Flow valuation with ease—simply input your Cost of Capital rates. Ideal for startups developing interactive hiking map apps, this tool supports detailed financial forecasting for mobile apps, incorporating key financial assumptions, operational expenses, and revenue streams. Optimize your investment analysis, break-even analysis, and profitability forecast while evaluating monetization strategies and market trends. Empower your interactive map app development project with accurate financial KPIs and cost-benefit analysis to drive informed decisions and secure funding sources.
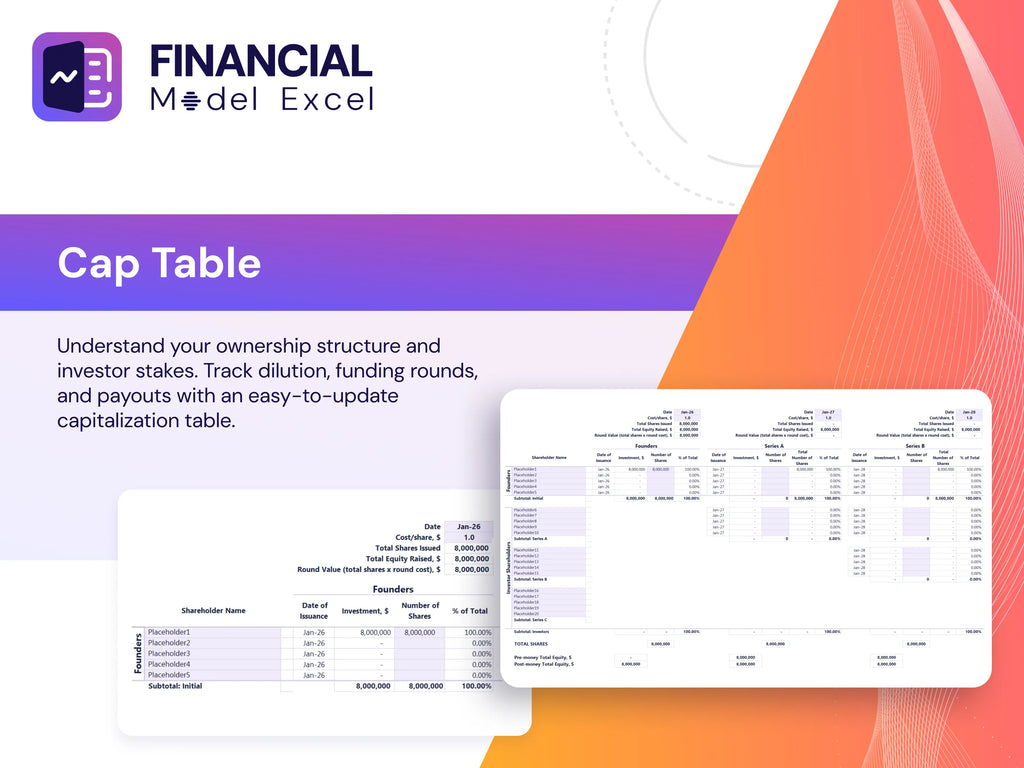
Cap Table
Our proforma business plan template features a detailed cap table covering four financing rounds, clearly illustrating how new investments influence overall investment income. After each funding stage, the cap table provides an updated ownership structure, highlighting percentage changes and dilution effects. This transparency is essential for precise financial forecasting for mobile apps, enabling startups to perform accurate investment analysis, app subscription financial modeling, and break-even analysis for app projects. Harness these insights to optimize your hiking app’s profitability forecast and align your financial KPIs with market trends and monetization strategies for hiking apps.
INTERACTIVE HIKING MAP APP FINANCIAL PLAN EXCEL ADVANTAGES
Empower your startup’s success with a financial model that drives hiking app profitability and scalable growth.
Optimize revenue and spot payment issues early using our financial forecast template for hiking app development.
A robust financial model enhances credibility, attracting investors by clearly showcasing your hiking app’s profit potential.
A robust financial model ensures precise budgeting, maximizing profits while guiding strategic growth for your hiking app.
A robust financial model ensures accurate forecasting, optimized revenue streams, and informed investment decisions for hiking app success.
INTERACTIVE HIKING MAP APP FINANCIAL PLANNING MODEL ADVANTAGES
A robust financial model for app development ensures precise forecasting, maximizing startups’ profitability and investor appeal.
Our financial model streamlines investment analysis and profitability forecasts, empowering confident decisions for hiking app success.
A robust financial model for app development builds stakeholder trust through clear revenue forecasts and cost structure insights.
A robust financial model ensures clear cash flow forecasts, building investor trust and accelerating funding for app growth.
The financial model for app development ensures accurate forecasting, boosting investor confidence and maximizing hiking app profitability.
Unlock precise financial forecasts and profitability insights effortlessly with our sophisticated, user-friendly hiking map app financial model.
Our financial model ensures accurate forecasting, maximizing revenue and profitability for your interactive hiking map app.
The financial model enables precise planning without formulas, coding, or costly consultants, accelerating your app’s success.
Our financial model empowers precise forecasting and profitability insights, optimizing hiking app development and monetization strategies.
Our dynamic 5-year financial model enables precise forecasting and profitability insights for scalable interactive hiking map apps.