


Obstacle Course Race Financial Model

5-Year Financial Projections
100% Editable
Investor-Approved Valuation Models
MAC/PC Compatible, Fully Unlocked
No Accounting Knowledge Needed
Obstacle Course Race Financial Model
Bundle Includes:
-
 Financial Model
-
 Business Plan
-
 Pitch Deck
-
 Financial Dashboard


ALL IN ONE MEGA PACK - CONSIST OF:
Obstacle Course Race Financial Model/Business Plan Excel Template
Pitch Deck Template For PowerPoint, Keynote & Google Slides
Business Plan Guide and Business Plan Template in MS Word Format
Financial Dashboard in Excel To Track Your Business Performance
OBSTACLE COURSE RACE FINANCIAL MODEL FOR STARTUP INFO
Highlights
The obstacle course race financial planning template offers a comprehensive 5-year financial projection specifically designed for businesses operating within the obstacle course race niche. This budget planning and expense analysis tool is ideal for both startups and small-scale operators looking to enhance their obstacle race financial strategy. Incorporating key elements such as revenue forecasting, cost management, and cash flow modeling, it enables robust obstacle race profitability modeling and investment analysis. With an unlocked, fully editable financial dashboard, users can perform detailed financial scenario analysis and risk assessment, ensuring precise obstacle event income modeling and obstacle race pricing strategy financial models are in place before committing to the business plan.
This ready-made obstacle course race financial model Excel template effectively alleviates common pain points associated with budget planning and expense analysis obstacle course race events by providing a comprehensive obstacle race financial planning template that streamlines cost management and financial projection obstacle race processes. It offers dynamic financial modeling for obstacle events, enabling precise obstacle race revenue forecasting and obstacle event income modeling to enhance decision-making and optimize profitability. Users benefit from integrated financial scenario analysis obstacle course features and an obstacle race cash flow model that support robust financial risk assessment obstacle events, ensuring sound obstacle race financial strategy development. Additionally, its built-in obstacle race pricing strategy financial model and investment analysis obstacle course race components simplify obstacle course race funding model planning and enable clear visibility through a financial dashboard obstacle course race, empowering buyers to efficiently manage their obstacle race business model finance and secure loans or investments with confidence.
Description
The obstacle course race financial model serves as a comprehensive tool for financial planning for obstacle races, incorporating key elements such as obstacle race revenue forecasting, expense analysis obstacle course race, and cost management obstacle course events. This adaptable model includes a 5-year monthly and yearly financial projection that integrates income and expenditure templates, cash flow models, and pro forma balance sheets tailored to obstacle race business model finance. Through financial scenario analysis obstacle course and investment analysis obstacle course race capabilities, it enables detailed obstacle race profitability modeling and financial risk assessment obstacle events to ensure sound decision-making. The model also offers obstacle race pricing strategy financial model features, facilitating precise obstacle race expense budgeting models and helping construct an effective obstacle race financial strategy. Equipped with essential financial performance ratios, KPIs, and a dynamic financial dashboard obstacle course race, this tool supports obstacle race funding model evaluation and provides clarity on startup costs and break-even points, ultimately guiding users to optimize obstacle event income modeling and secure sustainable growth.
OBSTACLE COURSE RACE FINANCIAL MODEL FINANCIAL MODEL REPORTS
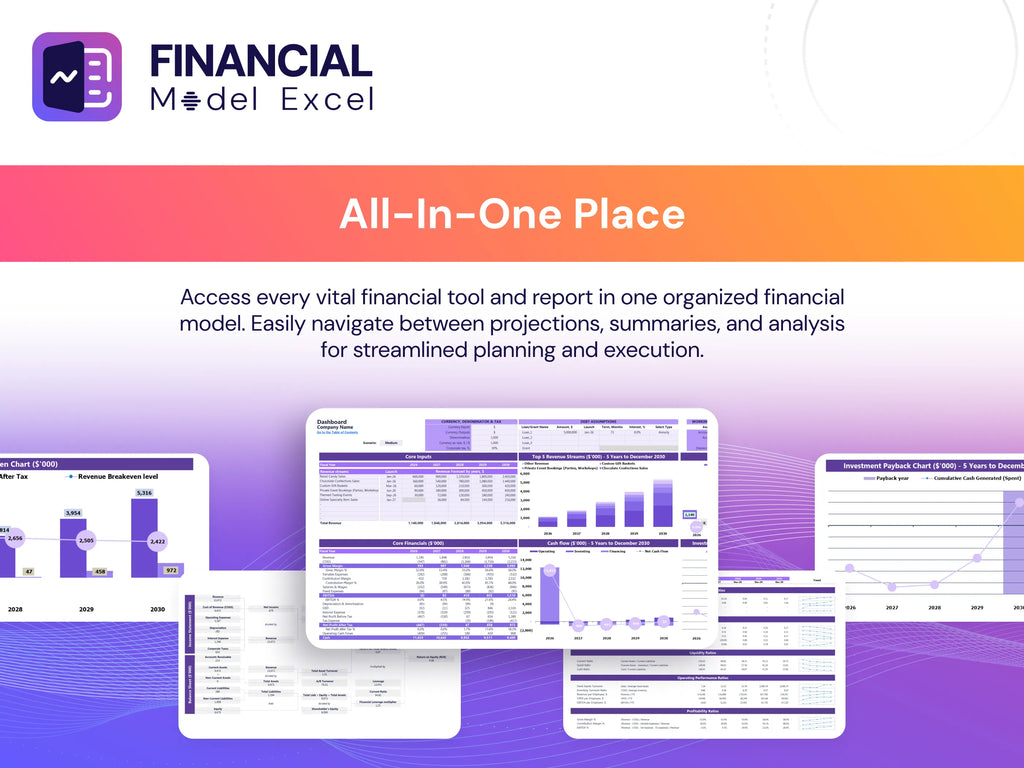
All in One Place
Get a comprehensive obstacle course race financial planning template featuring a 5-year financial projection in Excel. This dynamic model supports extensive scenario analysis, ensuring resilience as you adjust assumptions within the obstacle race business model finance framework. Designed for flexibility, it allows customization of revenue forecasting, expense analysis, and cost management to fit your unique obstacle event. Empower your financial strategy with an expandable tool that enhances obstacle race profitability modeling and investment analysis, providing clear insights for effective obstacle race pricing strategy and funding models. Optimize your obstacle race financial planning with confidence and precision.
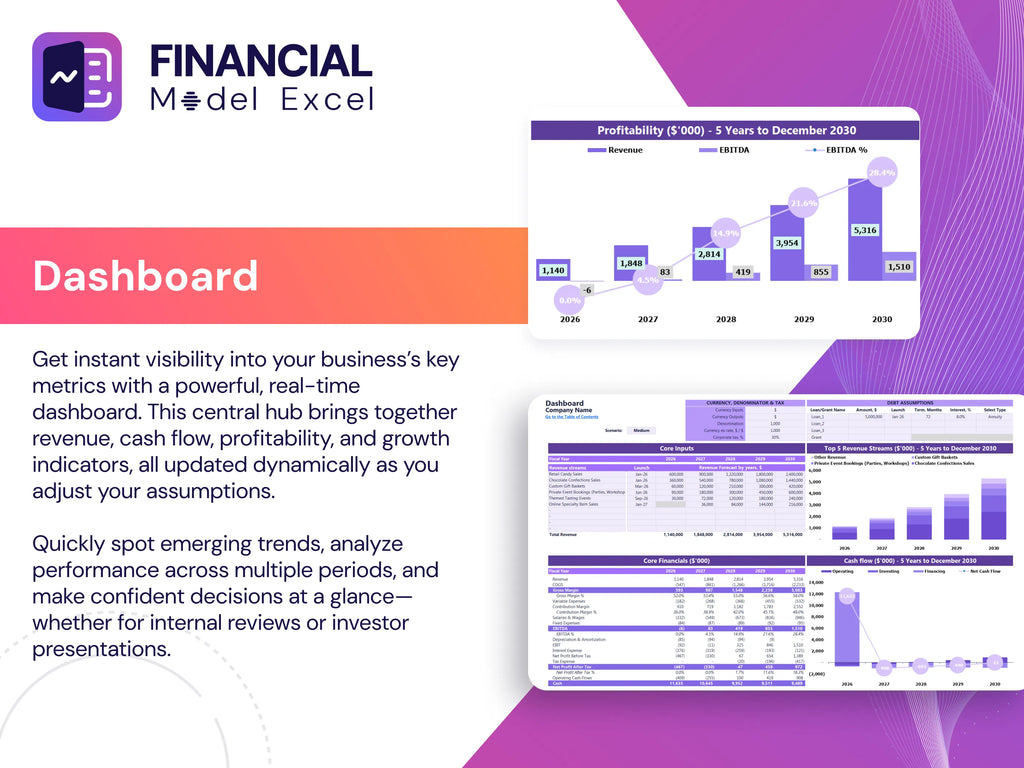
Dashboard
The Dashboard tab showcases your obstacle race financial planning template with dynamic graphs, ratios, and charts, enabling in-depth financial modeling for obstacle events. This interactive financial dashboard provides clear expense analysis, revenue forecasting, and profitability insights to enhance your obstacle race financial strategy. Designed for precise obstacle race cash flow modeling and financial risk assessment, it streamlines cost management and supports informed decision-making, ensuring your obstacle course race budget planning and investment analysis are data-driven and effective.
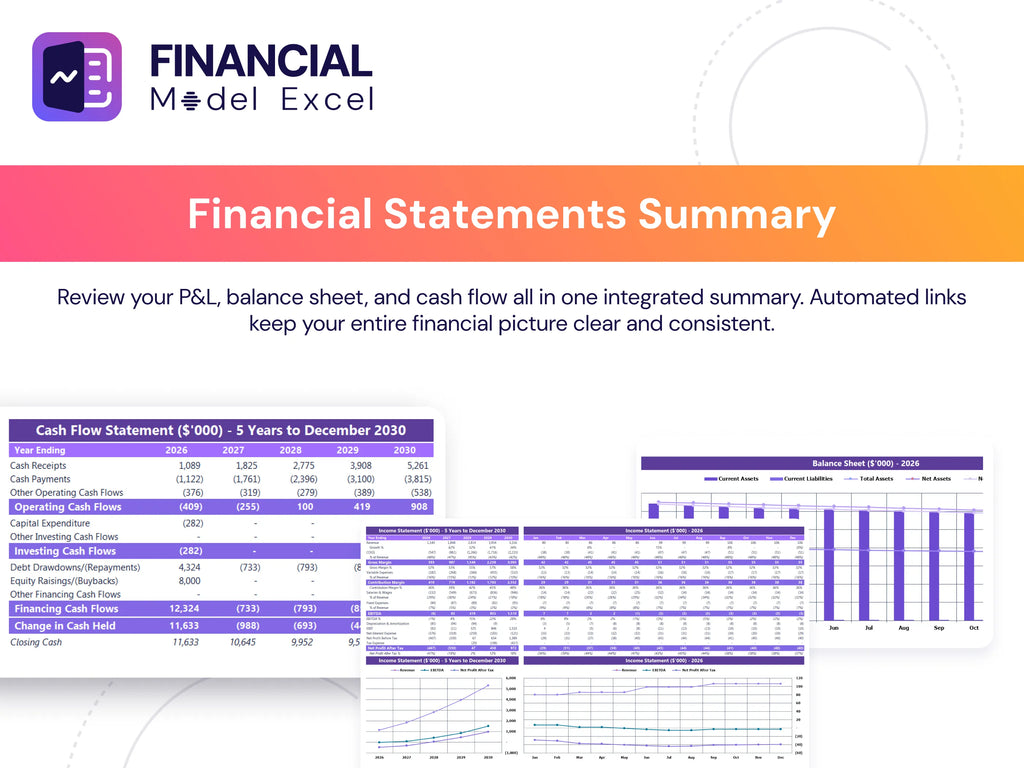
Business Financial Statements
Our obstacle course race financial planning template streamlines your budget planning and expense analysis by automatically generating comprehensive financial statements. Simply input your assumptions, and the integrated 3-way financial model delivers accurate revenue forecasting, cash flow projections, and profitability analysis. Designed for effective obstacle race financial strategy, this tool enhances investment analysis, cost management, and financial risk assessment, empowering you to optimize your obstacle event’s business model finance with confidence and precision.
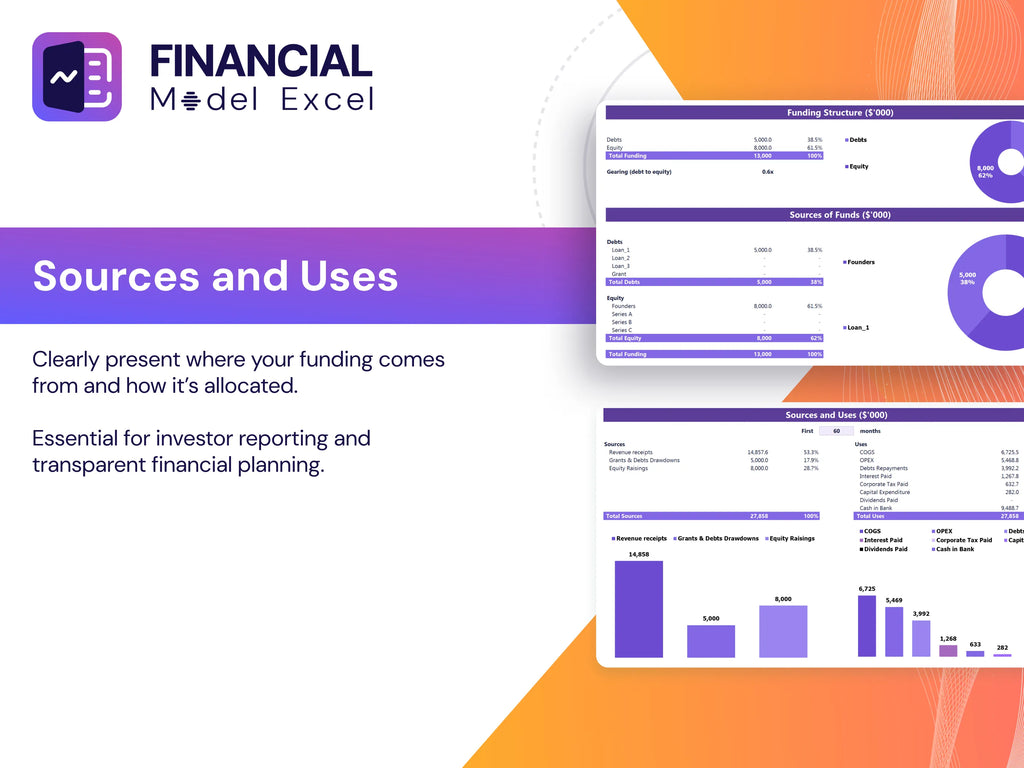
Sources And Uses Statement
A well-structured obstacle race financial planning template clearly outlines funding sources and expense budgeting models, ensuring balanced cash flow. Using financial modeling for obstacle events, owners detail each capital source and corresponding use, creating transparency for stakeholders. If funding exceeds planned uses, surplus funds can support expansion or reserves. Conversely, if expenses surpass sources, additional investment or cost management strategies are necessary. This obstacle race financial strategy is essential for accurate revenue forecasting, risk assessment, and profitability modeling, enabling successful budget planning and sustainable growth in obstacle course race ventures.
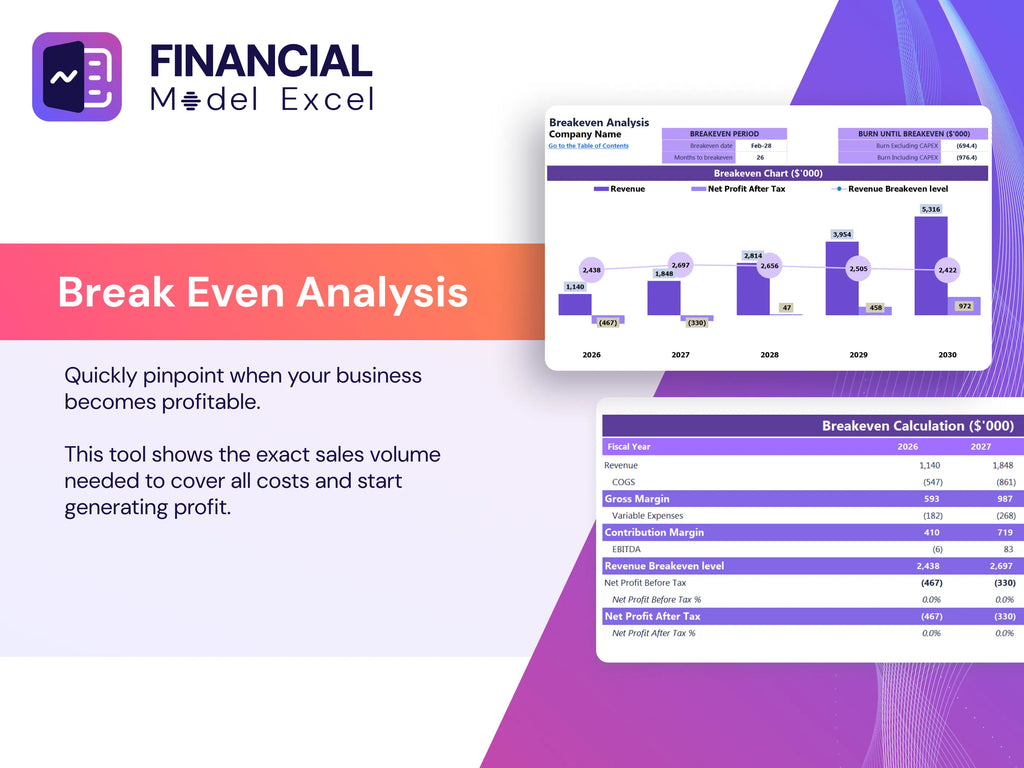
Break Even Point In Sales Dollars
Understanding your break-even point through obstacle race financial modeling is essential for informed decision-making. This obstacle race financial planning template enables accurate obstacle race revenue forecasting and expense analysis, unveiling your event’s viability and profitability potential. It empowers strategic cost management and financial risk assessment, helping you optimize non-essential expenses while enhancing obstacle race cash flow models. Moreover, break-even insights clarify when investments will be recovered, crucial for stakeholder communication and obstacle race funding models. Utilize this obstacle course race financial strategy to confidently forecast, plan, and maximize your event’s financial success with data-driven precision.
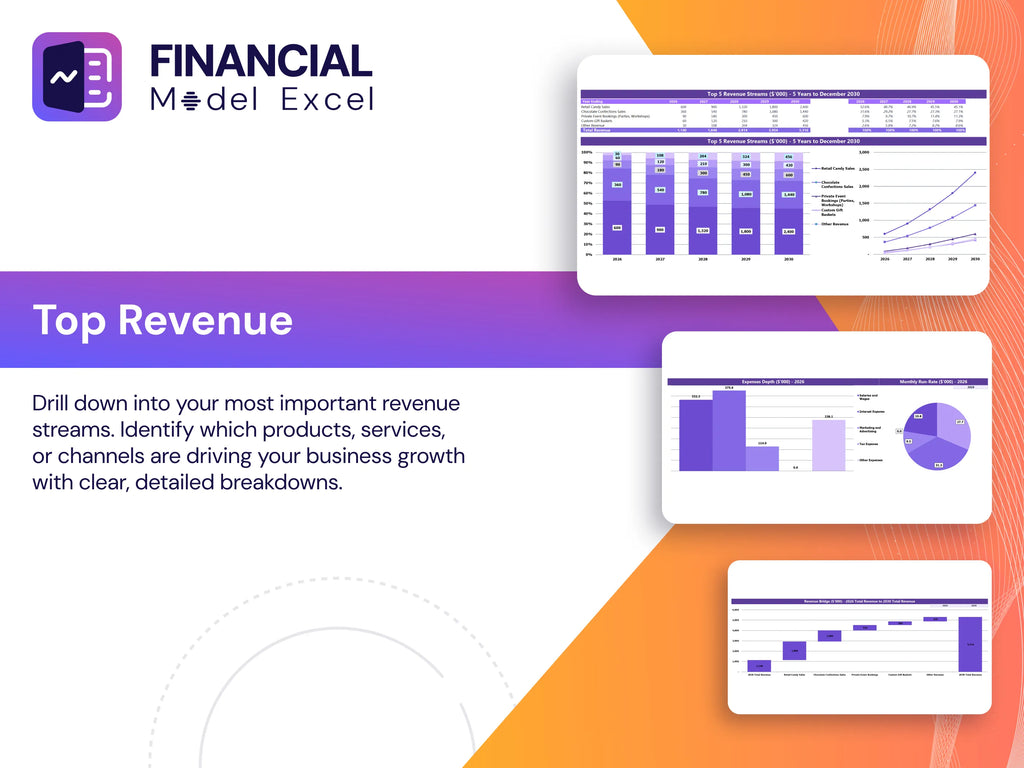
Top Revenue
This obstacle race revenue forecasting model features a dedicated tab for comprehensive revenue stream analysis. It meticulously breaks down income by product and service categories, enabling precise financial planning for obstacle races. This detailed expense analysis and financial projection obstacle race tool supports effective obstacle race financial strategy and cost management, enhancing overall obstacle course race profitability modeling.
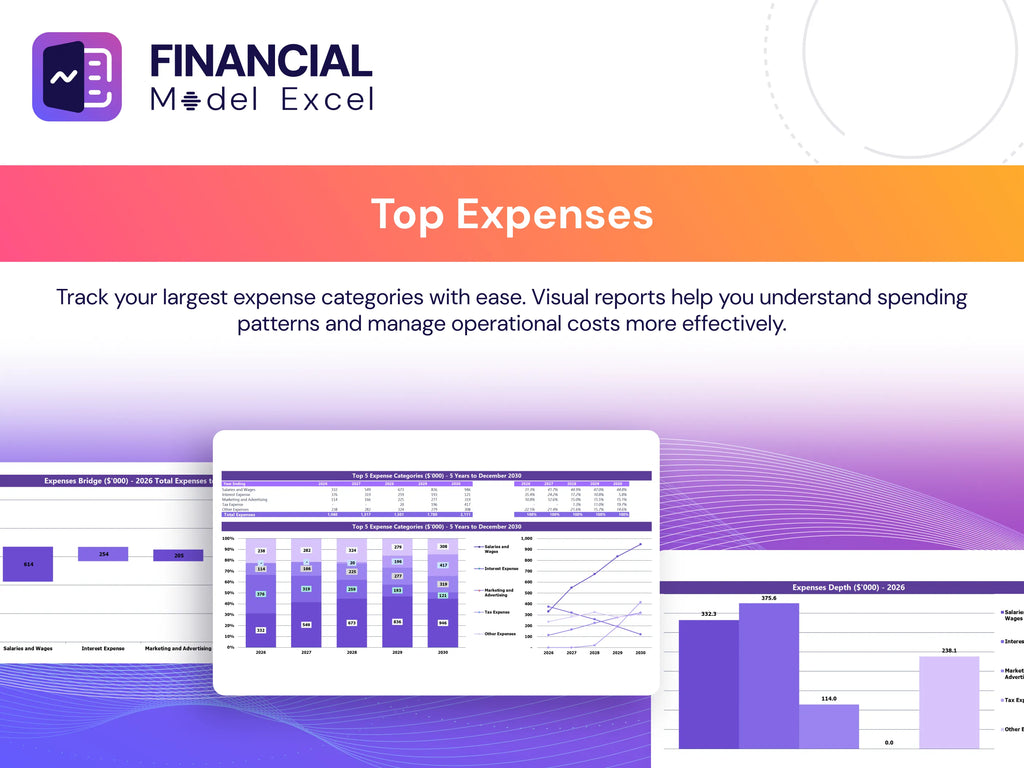
Business Top Expenses Spreadsheet
This financial projection obstacle race model features a comprehensive Top Expenses tab, categorizing costs into four primary groups plus an “Other” category for miscellaneous expenses. This structured approach supports precise expense analysis and cost management for obstacle course race events, enhancing financial planning for obstacle races. Utilize this model to optimize your obstacle race financial strategy, improve budget planning, and strengthen revenue forecasting with clear visibility into all expense areas.
OBSTACLE COURSE RACE FINANCIAL MODEL FINANCIAL PROJECTION EXPENSES
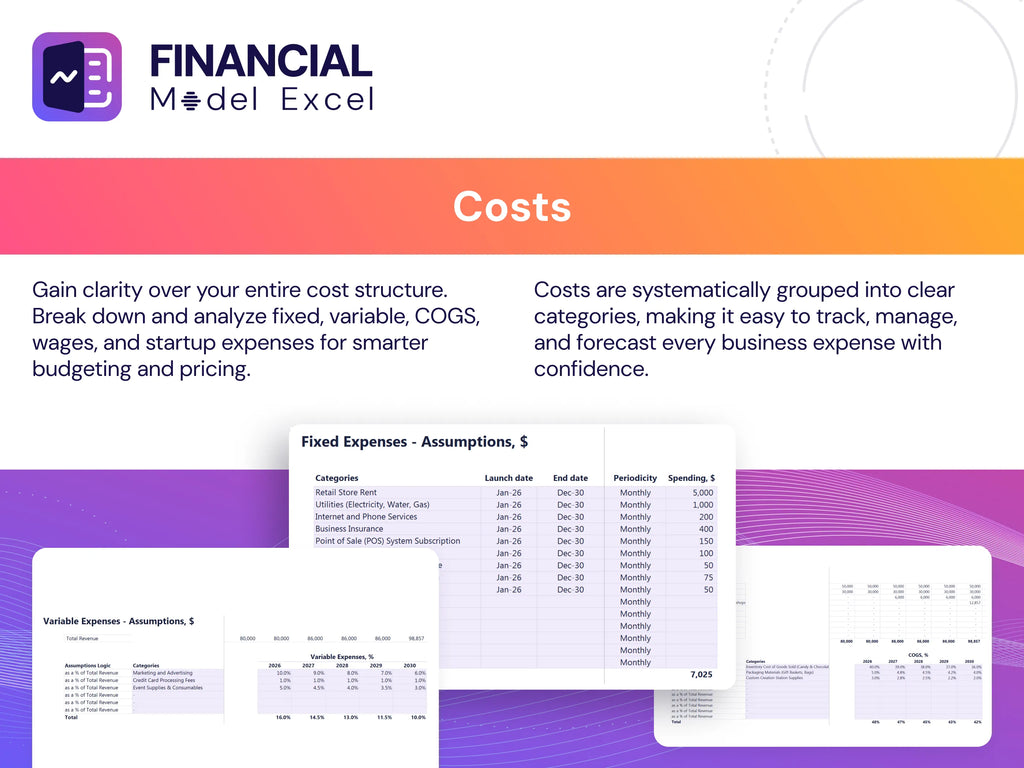
Costs
Our obstacle race financial planning template offers a comprehensive expense budgeting model to streamline cost management for up to 60 months. It integrates obstacle race revenue forecasting with detailed expense analysis, enabling precise financial projection and scenario analysis. Automated accounting classifications—COGS, fixed, variable, wages, or development costs—enhance accuracy. Built-in expense forecasting curves track changes over time as a percentage of revenue, recurring and growth rates. This financial dashboard supports effective obstacle race financial strategy, improving profitability models and cash flow management for obstacle course events. Ideal for obstacle race business model finance and investment analysis.
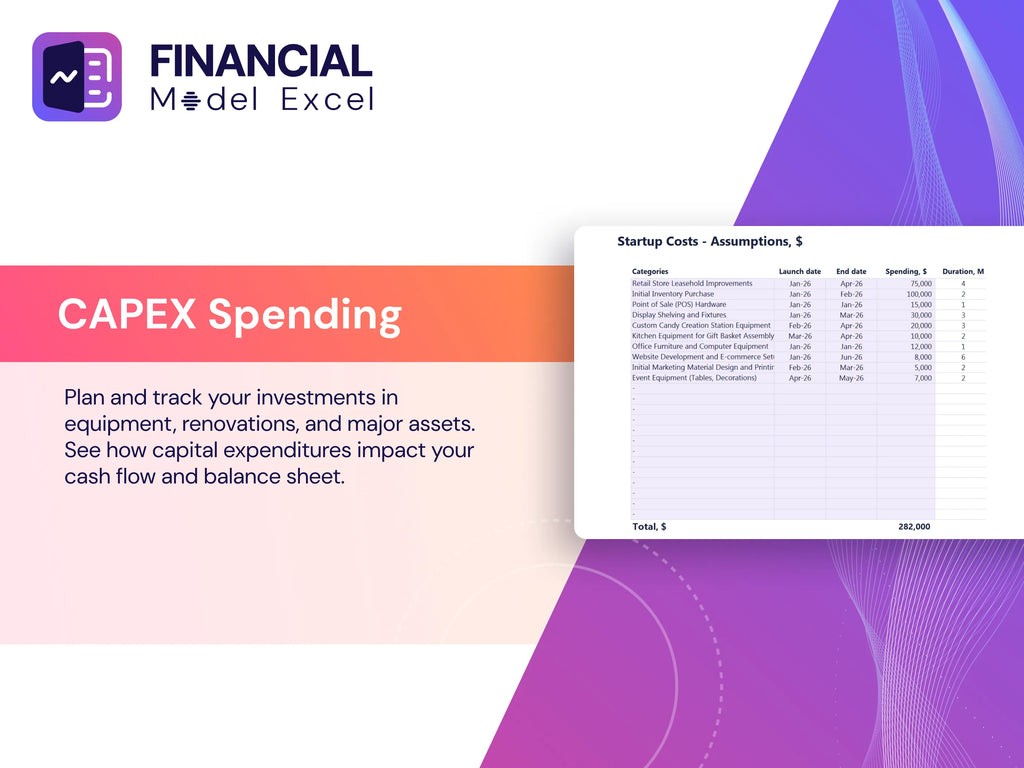
CAPEX Spending
The CAPEX plan is a crucial component in obstacle race financial planning templates, enabling precise expense analysis and start-up cost determination. For financial analysts, it drives the obstacle course race profitability model by monitoring initial investments essential for sustained cash flow. These capital expenditures directly impact the obstacle race cash flow model and are integral to effective cost management and obstacle race revenue forecasting. Incorporating CAPEX data within Excel financial dashboards ensures robust financial scenario analysis, guiding obstacle race pricing strategy and investment analysis to optimize overall obstacle event income modeling and financial risk assessment.
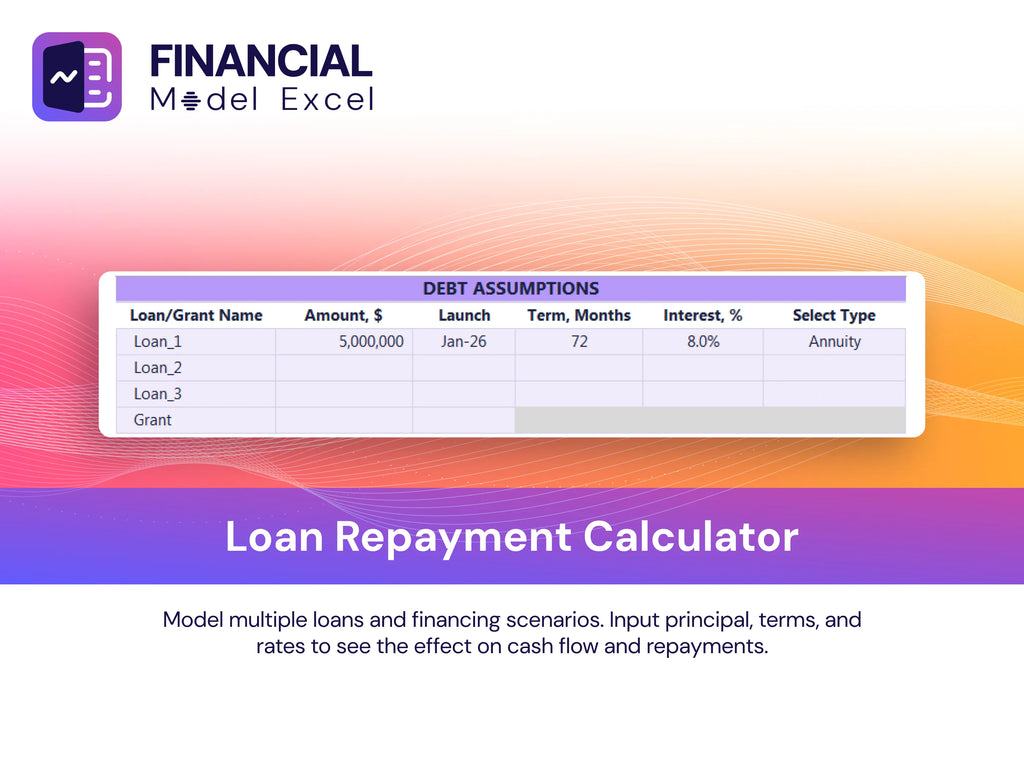
Loan Financing Calculator
Our obstacle race financial planning template features a built-in loan amortization schedule designed for precise budget planning. With embedded formulas, it clearly details repayment timelines across monthly, quarterly, or annual periods. Each installment transparently breaks down principal and interest, supporting effective expense analysis and cost management for obstacle course events. This financial dashboard empowers organizers with accurate financial projections and enhances obstacle race profitability models through insightful cash flow and risk assessment tools. Maximize your obstacle race revenue forecasting and investment analysis with our comprehensive obstacle race business model finance solution.
OBSTACLE COURSE RACE FINANCIAL MODEL EXCEL FINANCIAL MODEL METRICS
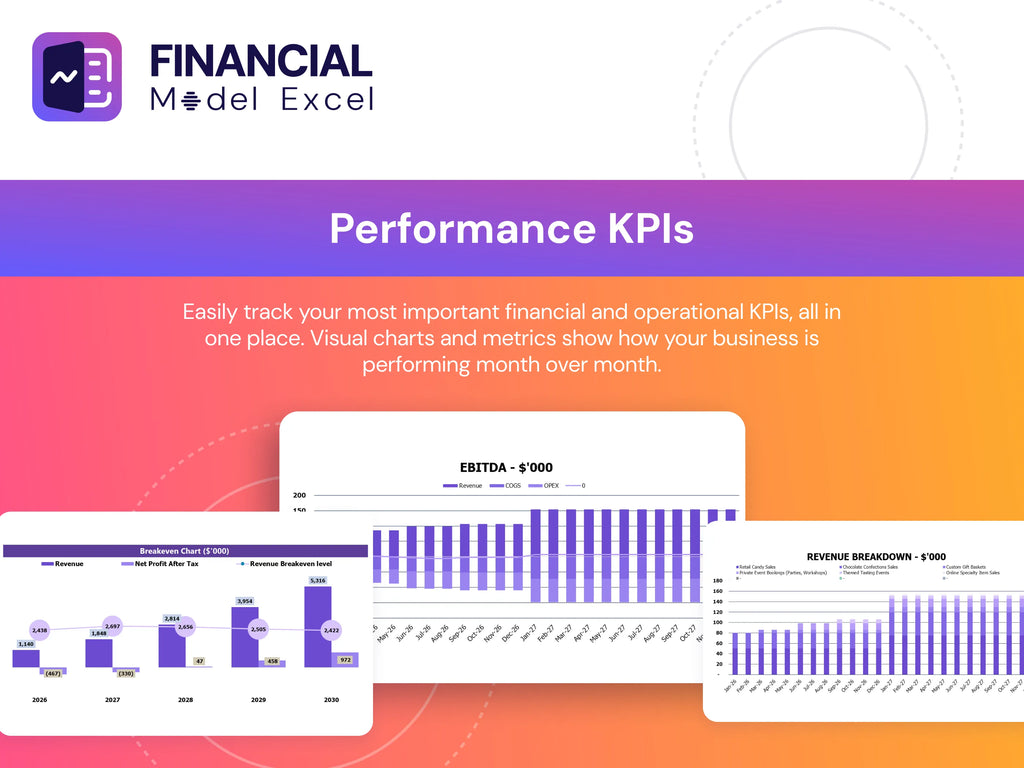
Financial KPIs
Return on Assets (ROA) is a key metric in obstacle race financial planning, derived from financial modeling for obstacle events using projected balance sheets and proforma income statements. ROA measures how efficiently an obstacle course race business manages its total assets to generate profits. A higher ROA signals strong profitability and effective cost management, essential for obstacle race revenue forecasting and financial projection. Leveraging ROA insights within an obstacle race financial strategy helps optimize expense analysis and enhance overall event profitability models.
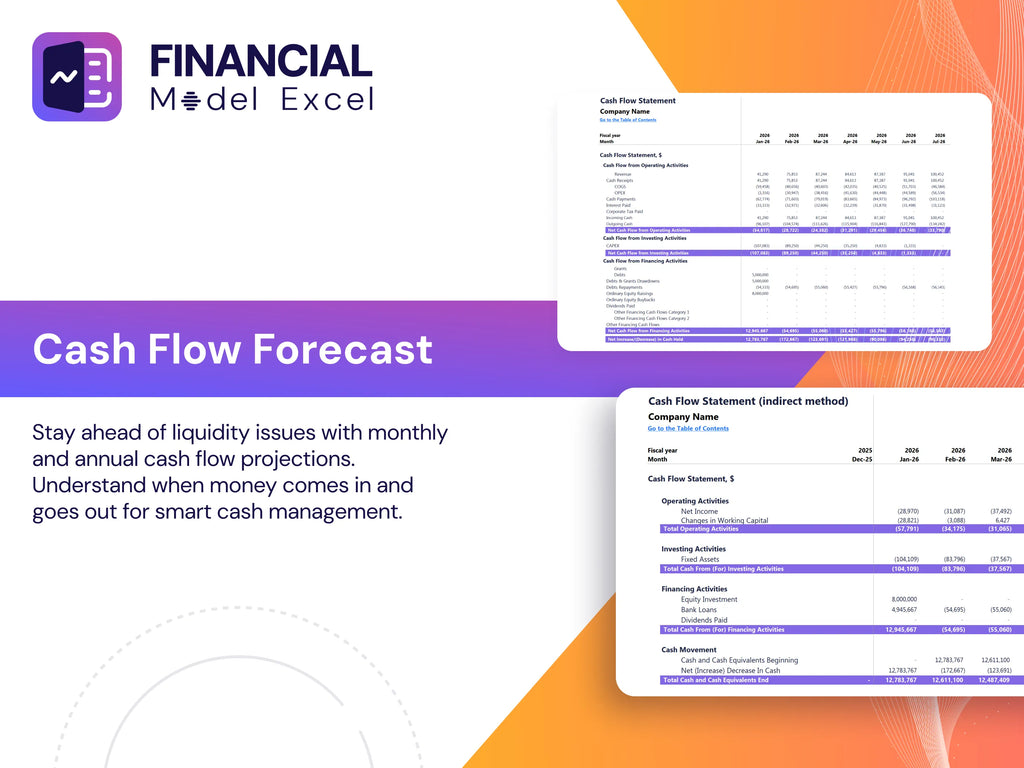
Cash Flow Forecast Excel
The obstacle race cash flow model focuses on operating cash flow, highlighting the cash generated solely from core event operations. Excluding secondary income such as interest or investments, this model provides a clear view of financial health specific to obstacle course race events. Utilizing this essential financial planning template supports accurate financial projection obstacle race initiatives, enabling effective cost management, expense analysis, and obstacle race revenue forecasting. This approach enhances obstacle race financial strategy, ensuring robust obstacle race profitability and sustainable event growth through data-driven financial scenario analysis.
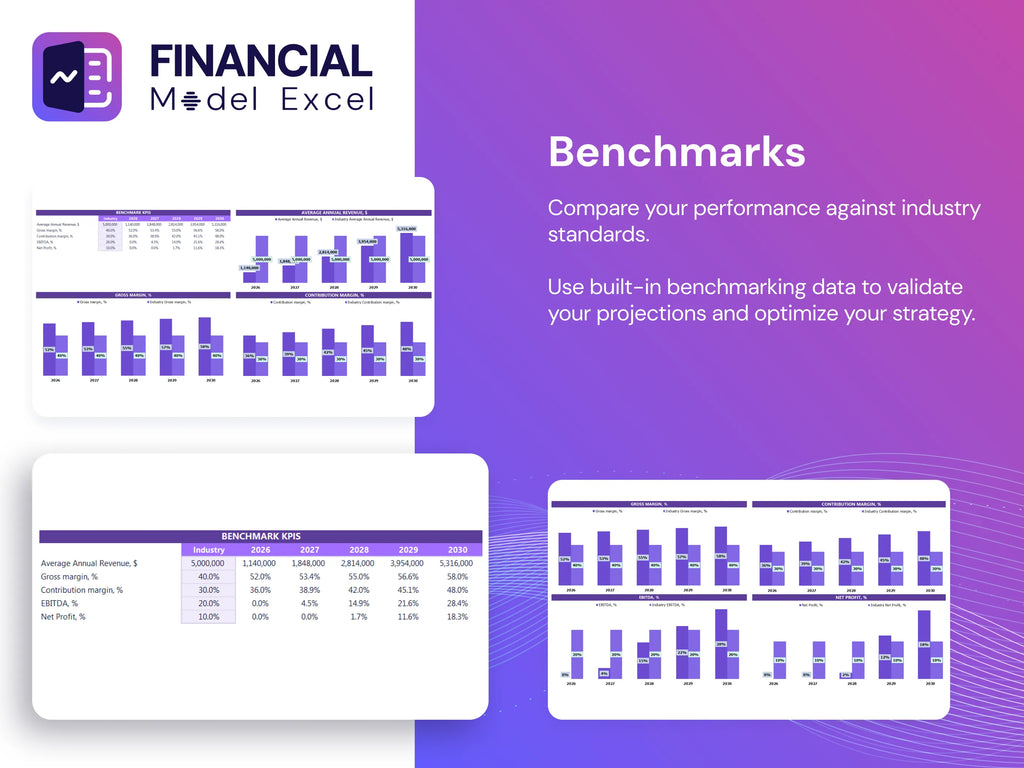
KPI Benchmarks
Benchmarking is essential in obstacle course race financial planning, enabling organizers to evaluate performance against top industry players. Using financial modeling for obstacle events, including revenue forecasting and expense analysis, helps identify key metrics like profit margins, cost efficiency, and cash flow. A robust obstacle race profitability model integrates these benchmarks, offering clear financial projections and scenario analyses. This empowers effective obstacle race financial strategy, streamlining cost management and investment analysis, and optimizing pricing strategies. Leveraging a financial dashboard tailored for obstacle course events ensures transparent, data-driven decisions that enhance overall event profitability and long-term sustainability.
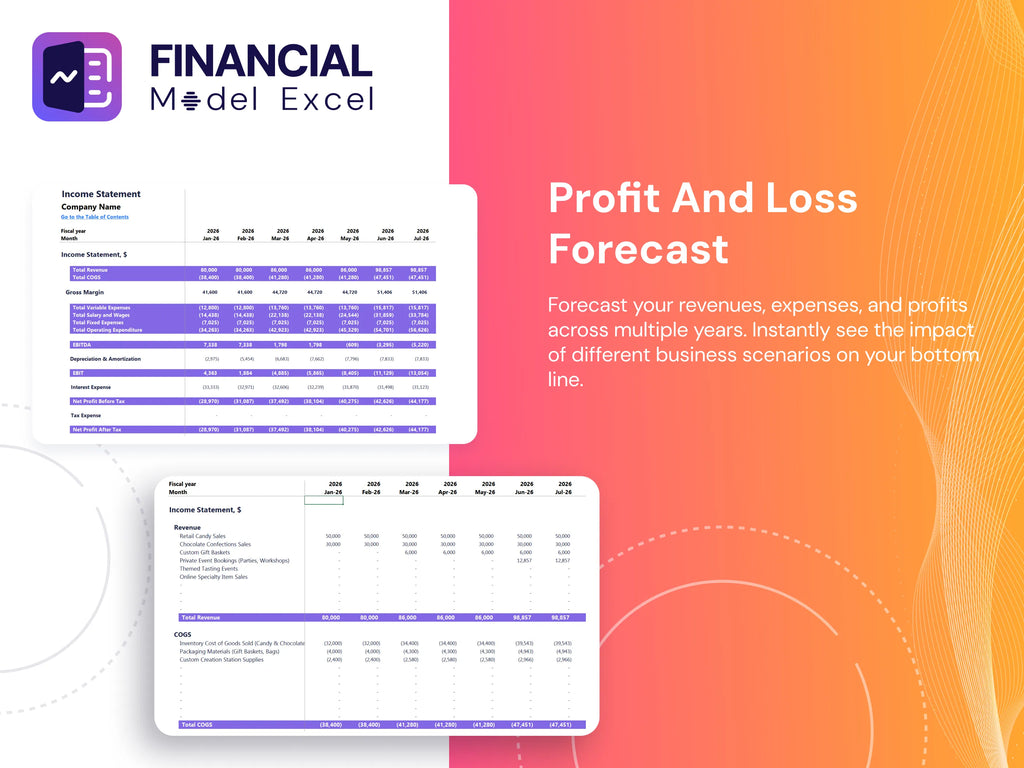
P&L Statement Excel
A well-constructed income statement is a cornerstone of any obstacle course race financial planning template. Serving as the primary tool for revenue forecasting and expense analysis, it directly highlights the event’s profitability and cash flow. Without precise monthly profit and loss reporting, obstacle race financial strategy becomes guesswork, risking unmanaged costs and missed opportunities. Meticulous financial modeling for obstacle events ensures that all revenue, expenses, and risks are accurately captured, providing a solid foundation for obstacle race pricing strategy and investment analysis. Clear financial projections empower better budget planning and drive sustainable profitability in obstacle course race business models.
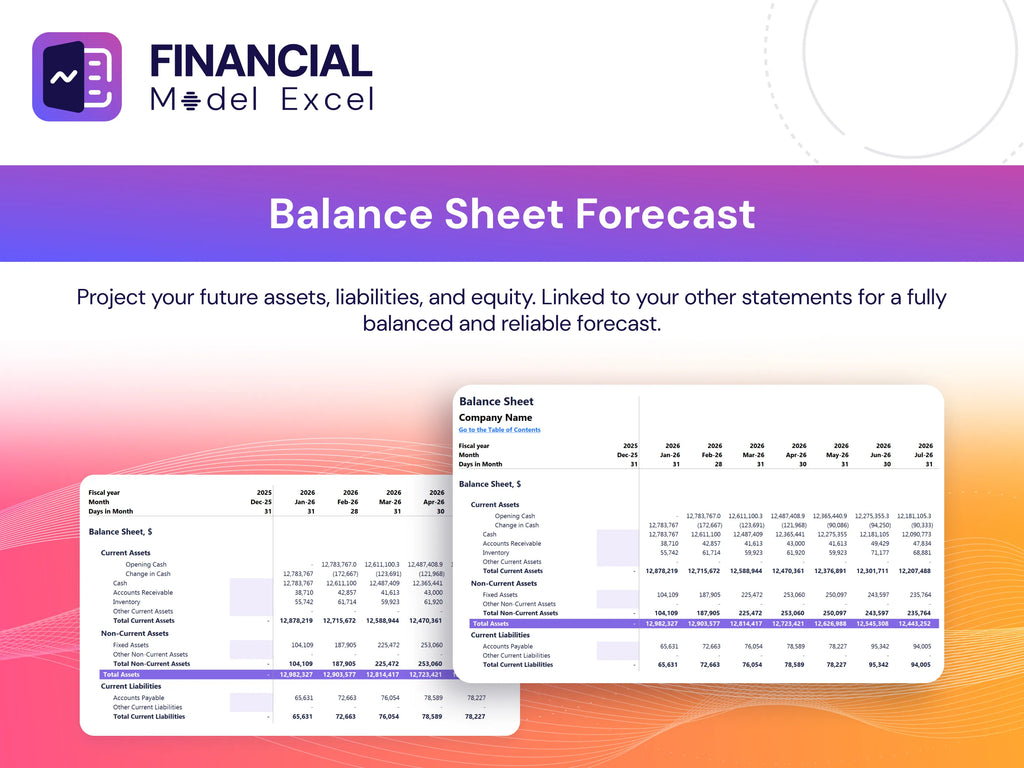
Pro Forma Balance Sheet Template Excel
A pro forma balance sheet is a vital financial projection tool that outlines an obstacle course race’s assets, liabilities, and equity over a specific period. This financial modeling for obstacle events offers clear insights into your event’s financial position, enabling effective expense analysis and cash flow management. Utilize our obstacle race financial planning template to accurately forecast revenue, manage costs, and assess profitability. Empower your obstacle event income modeling and investment analysis with precise financial scenario analysis, ensuring a robust obstacle race business model finance foundation for successful budget planning and strategic growth.
OBSTACLE COURSE RACE FINANCIAL MODEL FINANCIAL PROJECTION TEMPLATE VALUATION
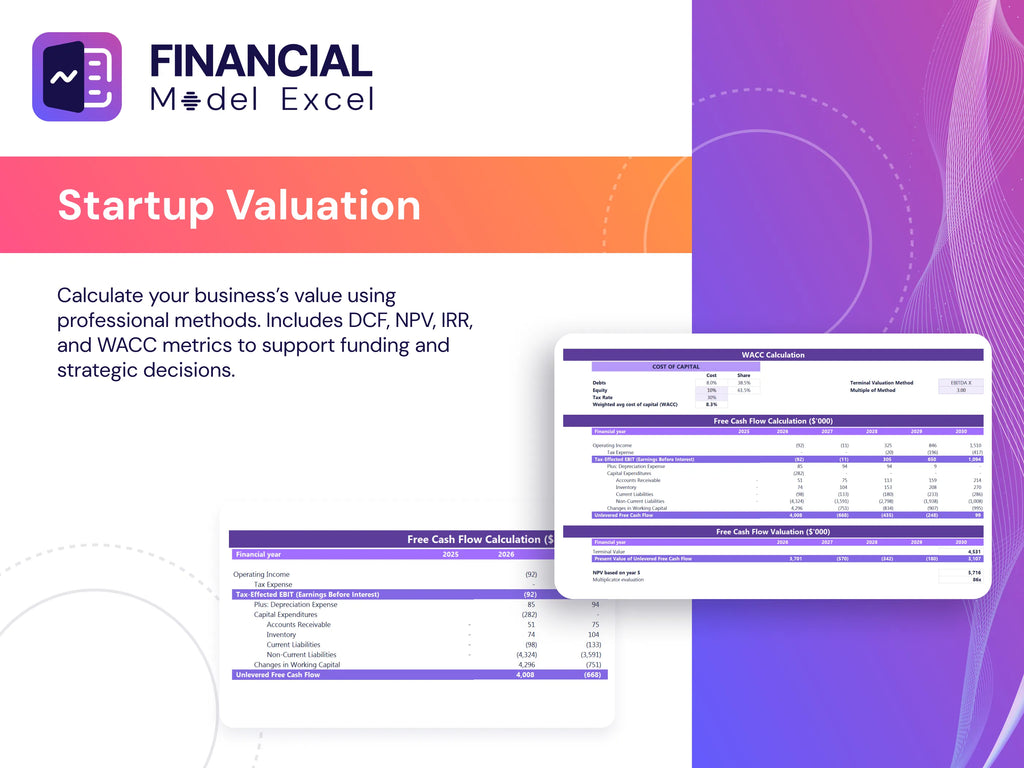
Startup Valuation Model
This obstacle course race financial model Excel template offers a comprehensive valuation analysis tab, enabling precise Discounted Cash Flow (DCF) assessments. Designed for obstacle race financial planning, it streamlines the compilation of key metrics including residual value, replacement costs, market comparables, and recent transaction comparables. Ideal for financial modeling in obstacle events, this tool enhances revenue forecasting, expense analysis, and investment analysis, supporting robust obstacle race profitability models and strategic financial risk assessment. Optimize your obstacle course race budget planning and cost management with this dynamic financial dashboard and forecasting solution.
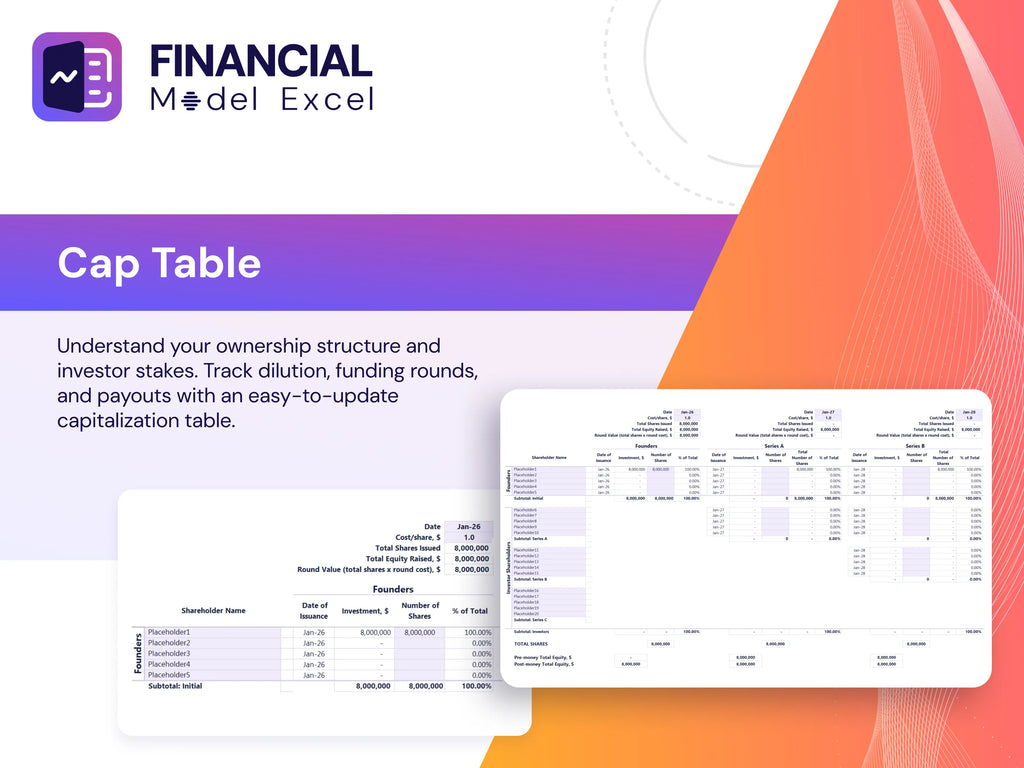
Cap Table
Effective obstacle race financial planning demands precise modeling tools to optimize profitability. Utilizing a comprehensive obstacle race financial strategy—including revenue forecasting, expense analysis, and cash flow modeling—enables clear insight into funding needs and investment potential. Integrating obstacle race expense budgeting models with financial risk assessments ensures sound cost management and maximizes return on investment. Just as a cap table unifies ownership understanding in startups, an obstacle race financial dashboard consolidates income modeling and scenario analysis, providing organizers with a holistic view to drive strategic decisions and sustained growth in competitive obstacle course events.
OBSTACLE COURSE RACE BUSINESS PROJECTION TEMPLATE ADVANTAGES
Establish milestones effortlessly with the obstacle race financial model, optimizing budgeting and boosting event profitability.
Financial modeling for obstacle races empowers precise budgeting and maximizes profitability through informed financial planning.
A tailored obstacle race financial model ensures precise budgeting, boosting profitability and strategic decision-making confidence.
Maximize profitability and control expenses using the obstacle course race financial model with 5-year cash flow projections.
Unlock global insights with our obstacle race financial model supporting 161 currencies for precise, multi-market planning advantage.
OBSTACLE COURSE RACE PROFIT LOSS PROJECTION ADVANTAGES
Optimize profitability with our obstacle course race financial model, enabling precise budgeting, forecasting, and strategic decision-making.
The obstacle race financial model enables precise forecasting and strategic adjustments, maximizing profitability and funding success.
Accurate obstacle race financial modeling ensures reliable forecasts, boosting stakeholder confidence and securing essential funding.
A robust obstacle race financial model ensures clear insights, boosting lender confidence and securing essential bank funding.
Achieve precise obstacle race revenue forecasting with a fully expandable, robust financial model for confident decision-making.
This robust financial model empowers precise obstacle race planning, ensuring optimized profitability and tailored strategic decision-making.
Optimize obstacle race profitability with a 5-year financial model for precise revenue forecasting and strategic expense management.
Optimize profitability with our integrated 5-year obstacle race financial model featuring monthly forecasts and automated annual summaries.
Optimize obstacle course race profitability with precise financial modeling—empowering investors with confident, data-driven decision-making.
Maximize obstacle race profitability with our financial model, featuring forecasted income, cash flow, balance sheet, and ratios.